Technical Appendix: When "Good Soil" Isn't
Complete Data Analysis and Scientific Mechanisms This appendix provides the full technical detail supporting the main article. It includes complete soil test data, detailed antagonism mechanisms, molecular biology, structural chemistry, biological collapse analysis, and scientific citations. Intended audience: Agricultural consultants, soil scientists, researchers, technical advisors, and advanced growers seeking comprehensive understanding.
David King
1/31/202648 min read
Technical Appendix: When "Good Soil" Isn't
Complete Data Analysis and Scientific Mechanisms
This appendix provides the full technical detail supporting the main article. It includes complete soil test data, detailed antagonism mechanisms, molecular biology, structural chemistry, biological collapse analysis, and scientific citations.
Intended audience: Agricultural consultants, soil scientists, researchers, technical advisors, and advanced growers seeking comprehensive understanding.
Table of Contents
Complete Soil Test Data
Comprehensive Comparison: Location A (Native Grazed Land) vs. Location B (Heavy Organic Amendments)
BASIC PROPERTIES
pH (Ideal: 6.4-6.5)
Location A: 5.3 ❌ (too acidic)
Location B: 7.0 ⚠️ (too high)
CEC (Cation Exchange Capacity)
Location A: 9.85 meq/100g (typical for sand)
Location B: 28.6 meq/100g (3× increase from amendments)
Organic Matter (Ideal: 15-20%)
Location A: 2.92% ❌ (low)
Location B: 11.5% ⚠️ (better but not target)
BASE SATURATION PERCENTAGES
CALCIUM (Ideal: 68%)
Location A: 37.9% ❌ (30 points LOW)
Location B: 78.8% ❌ (11 points HIGH)
MAGNESIUM (Ideal: 12%)
Location A: 16.25% ⚠️ (4 points HIGH)
Location B: 16.8% ⚠️ (5 points HIGH)
POTASSIUM (Ideal: 4%)
Location A: 2.55% ⚠️ (1.5 points LOW)
Location B: 2.6% ⚠️ (1.4 points LOW)
HYDROGEN (Ideal: 10%)
Location A: 36% ❌ (26 points HIGH - severely acidic)
Location B: 0% ❌ (ZERO buffering capacity)
MAJOR NUTRIENTS
CALCIUM (Ideal: 750 ppm)
Location A: 747 ppm ✅ (adequate)
Location B: 4,530 ppm ❌ (6× EXCESS)
MAGNESIUM (Ideal: 200 ppm)
Location A: 192 ppm ✅ (near target)
Location B: 576 ppm ❌ (3× EXCESS)
POTASSIUM (Ideal: 200 ppm)
Location A: 98 ppm ⚠️ (51% LOW)
Location B: 143 ppm ⚠️ (29% LOW)
PHOSPHORUS (Ideal: 100 ppm)
Location A: 7 ppm ❌ (93% LOW)
Location B: 393 ppm ❌ (4× EXCESS - drives antagonisms)
SULFUR (Ideal: 100 ppm)
Location A: 8 ppm ❌ (92% LOW - critical)
Location B: 100 ppm ✅ (target)
MICRONUTRIENTS
IRON (Ideal: 89 ppm)
Location A: 165 ppm ⚠️ (1.9× high)
Location B: 286 ppm ❌ (3.2× high but BLOCKED)
MANGANESE (Ideal: 50 ppm)
Location A: 52 ppm ✅ (adequate)
Location B: 27 ppm ⚠️ (46% LOW)
ZINC (Ideal: 20 ppm)
Location A: 8.2 ppm ⚠️ (59% LOW)
Location B: 44.6 ppm ❌ (2.2× high but BLOCKED)
COPPER (Ideal: 10 ppm)
Location A: 1.2 ppm ❌ (88% LOW)
Location B: 5.2 ppm ⚠️ (48% LOW)
BORON (Ideal: 2 ppm)
Location A: 0.2 ppm ❌ (90% LOW)
Location B: 1.8 ppm ⚠️ (10% LOW)
CRITICAL RATIOS
CALCIUM TO MAGNESIUM (Ideal: 5-7:1)
Location A: 2.33:1 ❌ (Mg dominates)
Location B: 4.69:1 ⚠️ (close but both excessive)
IRON TO MANGANESE (Ideal: 2:1)
Location A: 3.17:1 ⚠️ (1.6× off target)
Location B: 10.6:1 ❌ (5.3× OFF - severe imbalance)
ZINC TO COPPER (Ideal: 2:1)
Location A: 6.83:1 ❌ (3.4× off target)
Location B: 8.58:1 ❌ (4.3× OFF - catastrophic)
PHOSPHORUS TO POTASSIUM (Ideal: 1:1)
Location A: 0.07:1 ❌ (P severely deficient)
Location B: 2.75:1 ❌ (P dominates, blocks everything)
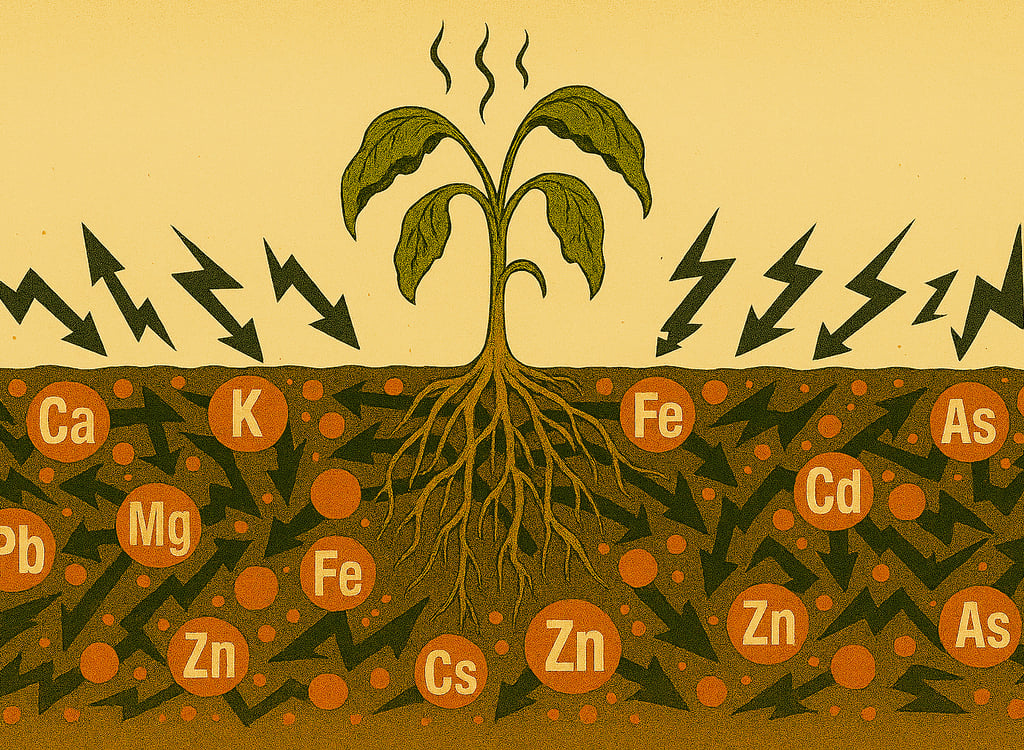
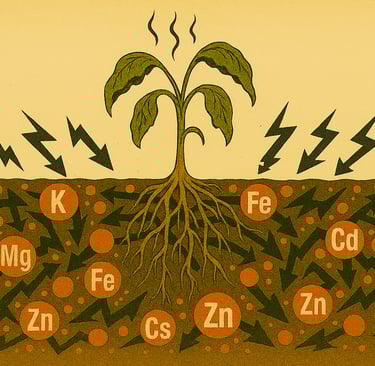
THE SEVEN ANTAGONISMS (Location B)
Despite high nutrient levels, crops show severely reduced genetic expression due to:
Calcium Excess (78.8%) → Blocks uptake of Mg, K, B
Magnesium Excess (16.8%) → Blocks uptake of Ca, K, Cu, Zn
Phosphorus Excess (393 ppm) → Blocks uptake of Zn, Fe, Mn, Cu
Zinc:Copper Catastrophe (8.58:1) → Zn blocked, Cu severely deficient
Iron Blocked (286 ppm present) → Mn dominates at 10.6:1 ratio
pH Too High (7.0) → Micronutrients precipitate, form hydroxides
Zero Buffering (0% H) → System locked, no flexibility
SUMMARY
LOCATION A: Multiple Deficiencies
Severely acidic (pH 5.3)
Low OM (2.92%)
Critical deficiencies: P, S, B, Cu
Needs: Lime, sulfur, micronutrients
LOCATION B: Antagonism Crisis
Heavy amendments without testing
Nutrients present but BLOCKED
Seven overlapping antagonisms
Plants cannot access what's there
Result: Severely reduced genetic expression
THE LESSON: Organic amendments work ONLY when guided by soil testing. Location B proves you can have excessive nutrients and starving plants at the same time.
Detailed Antagonism Mechanisms
Understanding the Three Mechanisms
Nutrient antagonisms operate through three primary mechanisms:
1. Transport Protein Competition Nutrients share transport proteins for cellular uptake. When excess amounts of one nutrient are present, they competitively inhibit others trying to use the same transporter.
2. Biochemical Interference Excess nutrients can disrupt enzymatic processes or form insoluble compounds that block other nutrients from being available.
3. Gene Expression Changes High concentrations of certain nutrients can down-regulate genes responsible for uptake of competing nutrients.
Molecular Mechanisms: Deep Dive into Transport, Genes, and Biochemistry
NOTE: This section provides molecular-level detail for advanced understanding of how nutrient antagonisms operate at the cellular level. Understanding these mechanisms explains why simple fertilizer addition often fails to correct imbalances.
Transport Protein Competition: The Molecular Gatekeepers
All nutrient uptake occurs through specific membrane-bound transport proteins. These proteins span the root cell membrane and selectively allow certain ions to enter. When multiple nutrients share the same transporter, competitive inhibition occurs.
Iron Transport Systems
IRT1 (Iron-Regulated Transporter 1):
Primary Fe²⁺ uptake transporter in roots
Also transports Zn²⁺, Mn²⁺, Cd²⁺ (competitive substrates)
Location: Root epidermal cells
Mechanism: High Zn or Mn competes for IRT1 binding sites, reducing Fe uptake even when Fe is abundant
In Location B: Excess Zn (44.6 ppm) and Fe (286 ppm) competing for IRT1 creates Zn-Fe and Fe-Mn antagonisms
ZIP Family (Zn-regulated transporter, Iron-regulated transporter Protein):
Multiple ZIP transporters (ZIP1, ZIP2, ZIP3, ZIP4, etc.)
Transport: Fe²⁺, Zn²⁺, Mn²⁺, Cu²⁺, Cd²⁺
Broad specificity = high competition
ZIP4 mutations cause acrodermatitis enteropathica (Zn deficiency despite adequate Zn)
Mechanism: Excess of any divalent cation blocks others
Ferric-Chelate Reductase:
Enzyme: FRO2 (Ferric Reduction Oxidase 2)
Converts Fe³⁺ → Fe²⁺ (required before IRT1 uptake)
Inhibited by: High Zn, high Mn, high pH
In Location B: pH 7.0 + excess Zn/Fe/Mn = reduced FRO2 activity = Fe unavailability despite 286 ppm Fe
Nramp Transporters (Natural resistance-associated macrophage protein):
NRAMP1, NRAMP3, NRAMP4 in plants
Transport: Fe²⁺, Mn²⁺, Cd²⁺, Zn²⁺
Intracellular transport (vacuole → cytoplasm)
Competition at this level affects metal distribution within plant
Zinc Transport Systems
ZIP Family (again - shared with Fe):
ZIP1, ZIP3, ZIP4, ZIP5 all transport Zn²⁺
Competition with Fe²⁺, Mn²⁺, Cu²⁺, Cd²⁺
Location B problem: 44.6 ppm Zn saturating ZIP transporters, blocking Cu uptake (8.58:1 Zn:Cu ratio)
HMA Family (Heavy Metal ATPases):
HMA2, HMA4 for Zn translocation
Active transport (requires ATP)
Also transport Cd²⁺ (why Cd is so dangerous - uses plant's Zn machinery)
Copper Transport Systems
COPT Family (Copper Transporter):
COPT1, COPT2 - high-affinity Cu⁺ uptake
Requires Cu²⁺ → Cu⁺ reduction first
Inhibited by: Excess Zn²⁺, Fe²⁺ (competition at reduction step)
Location B catastrophe: Zn excess (44.6 ppm) blocking COPT function
CTR Family (Copper Transporter):
Similar to yeast Ctr1/Ctr3
High-affinity Cu⁺ transport
Competitive inhibition by Zn, Fe, Cd
ZIP2 (dual function):
Also transports Cu under certain conditions
More competition with Fe, Zn, Mn
Manganese Transport Systems
NRAMP1:
Primary Mn²⁺ uptake transporter
Also transports Fe²⁺, Cd²⁺, Zn²⁺
Location B problem: Excess Fe (286 ppm) outcompeting Mn (27 ppm) for NRAMP1 binding
Fe:Mn ratio 10.6:1 means Fe saturates transporter, Mn can't enter
IRT1 (shared):
Also transports Mn²⁺ when Fe-deficient
Competition with Fe, Zn at this transporter
Calcium/Magnesium/Potassium Transport
Cation Channels:
Non-selective cation channels (NSCCs)
Transport: K⁺, Ca²⁺, Mg²⁺, Na⁺
Selectivity based on ion size and charge density
Location B problem: Ca²⁺ (78.8% saturation) and Mg²⁺ (16.8%) saturating channels, blocking K⁺ (2.6%)
HAK/KUP/KT Family (K⁺-specific):
High-affinity K⁺ transporters
Inhibited by: Excess NH₄⁺, Na⁺, Ca²⁺, Mg²⁺
Competitive inhibition mechanism: Divalent cations (Ca²⁺, Mg²⁺) preferentially bind due to higher charge
AKT1 (K⁺ channel):
Voltage-gated K⁺ channel
Inhibited by: Ca²⁺ (calcium-sensing affects voltage gating)
Location B: Excess Ca interfering with AKT1 regulation
Phosphorus Transport
PHT1 Family (Phosphate Transporter):
PHT1;1, PHT1;2, PHT1;4 - high-affinity H₂PO₄⁻ uptake
Co-transport with H⁺ (requires pH gradient)
Feedback inhibition: High internal P down-regulates PHT1 genes
Location B problem: 393 ppm P triggers massive PHT1 down-regulation, paradoxically creating P deficiency symptoms despite excess P
PHO1:
Loading P into xylem (root → shoot transport)
Regulated by P status
High P suppresses PHO1 expression
Gene Expression Regulation: The Molecular Switches
The principle: Nutrient concentrations trigger transcription factors that up-regulate or down-regulate transporter genes. Excess of one nutrient often down-regulates genes for competing nutrients.
Iron-Responsive Genes
FIT (FER-like Iron deficiency-induced Transcription factor):
Master regulator of Fe deficiency responses
Activates: IRT1, FRO2, and other Fe uptake genes
Paradox in Location B: High Fe in soil, but if unavailable (precipitated by pH/P), FIT activates → plant tries to take up more Fe → worsens Fe:Mn, Fe:Zn ratios
bHLH Transcription Factors:
bHLH38, bHLH39, bHLH100, bHLH101
Form heterodimers with FIT
Regulate entire Fe uptake regulon
Also regulate Zn homeostasis genes - creating Fe-Zn cross-talk
Zinc-Responsive Genes
bZIP Transcription Factors:
bZIP19, bZIP23 - Zn deficiency responses
Activate ZIP4, ZIP9 under Zn deficiency
Location B problem: Excess Zn (44.6 ppm) suppresses bZIP activity → ZIP transporters down-regulated even though plant needs to take up Cu, which uses some same transporters
ZAT (Zinc finger AT-hook):
Regulates Zn homeostasis
Cross-talks with Fe homeostasis genes
High Zn suppresses Fe uptake genes
Phosphorus-Responsive Genes
PHR1 (Phosphate Starvation Response 1):
Master regulator of P deficiency responses
Activates: PHT1 transporters, phosphatase genes, organic acid exudation
Location B: Excess P (393 ppm) suppresses PHR1 → entire P uptake/remobilization system shut down
SPX Proteins:
Negative regulators of PHR1
Bind PHR1 when cellular P is high, preventing P uptake gene activation
In excess P soils: SPX proteins lock down all P-related genes
P-Zn-Fe Cross-Talk:
High P suppresses IRT1, ZIP genes (Fe/Zn uptake)
P excess increases PHO1 → more P transported to shoots → Fe/Zn precipitate as phosphates in xylem
Triple mechanism blocking micronutrients
Potassium-Responsive Genes
HAK5:
High-affinity K⁺ transporter gene
Activated under K deficiency
Inhibited by: NH₄⁺, Na⁺, and antagonism from Ca/Mg excess
Location B: Ca and Mg excess blocks even HAK5-mediated K uptake
Biochemical Interference Mechanisms
Beyond transport proteins, nutrients interfere with each other through chemical reactions, enzyme inhibition, and precipitation.
Precipitation Reactions (Removing Nutrients from Solution)
Phosphate Precipitates:
Iron Phosphate (FePO₄):
Ksp (solubility product) = 1.3 × 10⁻²² (extremely insoluble)
Forms at pH > 6.0
Location B: pH 7.0 + 393 ppm P + 286 ppm Fe = massive FePO₄ precipitation
Why Fe chelates sometimes work: Chelated Fe (Fe-EDTA, Fe-EDDHA) resists precipitation
Zinc Phosphate (Zn₃(PO₄)₂):
Ksp = 9.0 × 10⁻³³ (even less soluble than FePO₄)
Forms readily at neutral to alkaline pH
Location B: 44.6 ppm Zn + 393 ppm P → Zn₃(PO₄)₂ precipitate
Paradox: Both Zn and P excessive, yet both become unavailable
Calcium Phosphate (Ca₃(PO₄)₂, hydroxyapatite):
Multiple forms: CaHPO₄, Ca₃(PO₄)₂, Ca₅(PO₄)₃OH
Form based on pH and Ca:P ratio
Location B: 4508 ppm Ca + 393 ppm P → extensive calcium phosphate formation
Why organic acids help: Citrate, malate, oxalate can dissolve these precipitates
Hydroxide Precipitates (pH-Dependent):
Ferric Hydroxide (Fe(OH)₃):
Forms at pH > 6.5
Rust-colored precipitate
Every 1-unit pH increase = 100-fold reduction in Fe³⁺ solubility
Location B at pH 7.0: Massive Fe(OH)₃ precipitation
Manganese Dioxide (MnO₂):
Forms at pH > 6.5 in oxidizing conditions
Black precipitate
Location B: pH 7.0 + oxidizing conditions → MnO₂ formation → Mn unavailability
Copper Hydroxide (Cu(OH)₂):
Forms at pH > 6.5
Blue-green precipitate
Location B: pH 7.0 + already-blocked Cu (Zn competition) → Cu(OH)₂ removes remaining available Cu
Zinc Hydroxide (Zn(OH)₂):
Forms at pH > 7.0
White precipitate
Even at 44.6 ppm Zn, some precipitates at pH 7.0
Enzyme Inhibition Mechanisms
Competitive Enzyme Inhibition:
Rubisco (Ribulose-1,5-bisphosphate carboxylase/oxygenase):
CO₂ fixation enzyme in photosynthesis
Mg²⁺ is the cofactor - required for activity
Ca²⁺ can bind to Mg²⁺ site but doesn't activate enzyme
Location B: Excess Ca (78.8%) displacing Mg from Rubisco → reduced photosynthesis despite adequate Mg (16.8%)
Nitrate Reductase:
First step in N assimilation
Mo cofactor required
Inhibited by: Excess sulfate (SO₄²⁻ competes with NO₃⁻ for uptake)
Also inhibited by high Zn, Cu
ATP Synthase:
Energy production
Requires Mg²⁺ cofactor
Inhibited by: Excess Ca²⁺ (competitive binding)
Excess Al³⁺ (binds more tightly than Mg²⁺)
Superoxide Dismutase (SOD):
Antioxidant enzyme
Cu/Zn-SOD and Mn-SOD isoforms
Zn excess reduces Cu/Zn-SOD activity (wrong Zn:Cu ratio)
Fe excess reduces Mn-SOD activity (wrong Fe:Mn ratio)
Location B: Both SOD systems impaired → oxidative stress → reduced productivity
Cell Wall and Membrane Effects
Calcium's Role:
Cross-links pectin in cell walls (Ca²⁺ bridges)
Structural integrity
But excess Ca (78.8%) creates overly rigid cell walls
Reduces cell expansion
Impairs nutrient movement through apoplast
Magnesium-Induced Dispersion:
Mg²⁺ at >15% saturation disperses clay
Mechanism: Mg²⁺ hydration shell is larger than Ca²⁺
Weaker electrostatic binding between clay particles
Location B at 16.8% Mg: Clay dispersion even in sandy soil
Creates compaction, reduces O₂, impairs root growth
Boron-Pectin Complexes:
B cross-links pectin polymers (similar to Ca)
Required for cell wall integrity
High Ca interferes with B-pectin binding
Location B: Excess Ca (78.8%) + neutral pH → B deficiency likely despite 3.1 ppm B
Synergistic Relationships (When Nutrients Help Each Other)
Not all nutrient interactions are antagonistic. Understanding synergies helps correct imbalances.
Nitrogen → Phosphorus:
N increases root growth → more P uptake
N increases organic acid exudation → solubilizes P
Application: Adding N can help plants access locked-up P
Phosphorus → Zinc (at deficiency levels):
Adequate P improves Zn uptake when both are low
But reverses at excess: High P locks up Zn
Location B: At 393 ppm P, this is pure antagonism
Sulfur → Molybdenum:
Both involved in protein synthesis
S improves Mo uptake
Mo-containing enzymes require S-containing amino acids
Calcium → Boron:
At balanced levels, Ca and B work together in cell walls
But at excess Ca (Location B): Becomes antagonistic
Iron → Molybdenum:
At deficiency levels, both help each other
Fe required for Mo-containing enzymes (nitrate reductase)
The Cascade Effect: How Multiple Mechanisms Compound
Example: Copper Deficiency in Location B
Starting point: 5.2 ppm Cu in soil (adequate amount)
Mechanism 1 - Transport Competition (Zn):
44.6 ppm Zn saturates ZIP2 transporters
8.58:1 Zn:Cu ratio means Zn outcompetes Cu for binding sites
Estimated reduction in Cu uptake: 60-70%
Mechanism 2 - Transport Competition (Fe):
286 ppm Fe also competes for ZIP transporters
Fe²⁺ and Cu²⁺ share reduction step before uptake
Additional 20-30% reduction
Mechanism 3 - Transport Competition (Mg):
16.8% Mg saturation interferes with divalent cation uptake
Mg²⁺ preferentially held on cation exchange sites
Additional 10-15% reduction
Mechanism 4 - Gene Expression (Zn excess):
High Zn suppresses ZIP4, ZIP5 expression
Reduces number of Cu transporters available
Multiplicative effect with transport competition
Mechanism 5 - Biochemical (pH precipitation):
pH 7.0 causes Cu(OH)₂ formation
Removes Cu²⁺ from soil solution
Even less Cu available for uptake
Mechanism 6 - Enzymatic (SOD impairment):
Wrong Zn:Cu ratio reduces Cu/Zn-SOD activity
Plant experiences Cu deficiency symptoms even if some Cu enters
Physiological Cu deficiency despite cellular Cu presence
Cumulative effect: Plant receives <10% of the Cu it needs despite adequate soil Cu.
Why adding Cu fertilizer fails:
Doesn't address Zn excess (Mechanism 1)
Doesn't address Fe excess (Mechanism 2)
Doesn't address Mg excess (Mechanism 3)
Doesn't address pH (Mechanism 5)
Must remove the blockages, not add more Cu
Correction Strategy Based on Molecular Understanding
Understanding these mechanisms informs correction protocols:
1. Transport Competition Correction:
Reduce excess nutrients blocking transporters
Use Ca to displace excess Mg (68% Ca target, not 78.8%)
Use sulfur to lower pH, increasing metal solubility
Temporal strategy: Create competitive advantage for deficient nutrient during critical growth stage
2. Gene Expression Management:
Apply deficient nutrients in forms that bypass down-regulated genes
Example: Foliar Cu bypasses root ZIP transporter down-regulation
Example: Fe-chelates can enter even when IRT1 suppressed
But these are expensive, temporary fixes
3. Biochemical Correction:
Lower pH to dissolve hydroxide precipitates
Use organic acids (citrate, malate) to dissolve phosphate precipitates
EDTA-chelated micronutrients resist precipitation
Sulfur is key: Elemental S → oxidizes → H₂SO₄ → lowers pH
4. Ratio-Based Fertilization:
Don't just correct deficiency - correct RATIOS
Ca:Mg target: 5-7:1 (Location B at 4.69:1, but both excessive)
Zn:Cu target: 2-3:1 (Location B at 8.58:1 - catastrophic)
Fe:Mn target: 2-5:1 (Location B at 10.6:1 - severe)
Must reduce excesses AND add deficiencies simultaneously
Molecular Basis for the Albrecht Method
Why the Albrecht Method works: It's based on these molecular mechanisms, even though Albrecht worked before molecular biology existed.
The genius of target percentages:
68% Ca = optimal for cation exchange without blocking other cations
12% Mg = adequate for plant needs without clay dispersion
4% K = sufficient without being blocked by Ca/Mg
10-15% H = buffering capacity for system flexibility
These aren't arbitrary numbers - they reflect the molecular reality of transport protein competition, cation selectivity, and biochemical requirements.
Location B violated these ratios:
78.8% Ca (10.8 points over) → saturating calcium channels, blocking K/Mg transport
16.8% Mg (4.8 points over) → clay dispersion, K competition
2.6% K (1.4 points under) → insufficient despite adequate ppm due to competitive inhibition
0.0% H → zero buffering, system locked
The molecular mechanisms explain WHY these violations create the cascade of antagonisms we observe.
THE SEVEN ANTAGONISMS: Complete Breakdown
ANTAGONISM 1: Calcium → Magnesium, Potassium, Boron
The Problem:
Calcium at 78.8% saturation (10.8 points above 68% target)
Total excess Ca = 1,500 ppm above target range
Mechanism:
Ca → Mg:
Ca²⁺ and Mg²⁺ are both divalent cations competing for the same uptake sites
At high Ca concentrations, transport proteins preferentially bind Ca²⁺
Mg²⁺ uptake is competitively inhibited even though Mg is present at 16.8% (adequate)
Result: Mg deficiency symptoms despite adequate Mg in soil
Ca → K:
Ca²⁺ takes up exchange sites that K⁺ needs
Ca:K ratio of 15.5:1 (should be <15:1)
K⁺ is a monovalent cation (smaller charge) vs. Ca²⁺ divalent
Clay and humus particles preferentially hold Ca²⁺ over K⁺
Result: K squeezed off exchange sites
Ca → B:
Excess Ca interferes with boron uptake
High Ca can precipitate boron as calcium borate
This soil shows borderline low B (0.8 ppm vs. 1.0 target) despite compost addition
Result: Boron deficiency risk increasing
Scientific Documentation:
Ros et al. (2017): Ca-Mg antagonism documented in 12 of 94 studies reviewed
Fan et al. (2021): Identified Ca-K transport competition at molecular level
ANTAGONISM 2: Magnesium → Calcium, Potassium, Phosphorus
The Problem:
Magnesium at 16.8% (4.8 points above 12% target)
Mg excess at 810 ppm (2× target)
Mechanism:
Mg → Ca:
Bidirectional antagonism with calcium
Excess Mg blocks Ca²⁺ transport proteins
Can induce Ca deficiency symptoms in high-Mg soils
Mg → K:
Divalent Mg²⁺ vs. monovalent K⁺
Mg²⁺ is preferentially held on exchange sites
K⁺ displacement from soil colloids
At 16.8% Mg, K uptake is significantly impaired
Mg → P:
High Mg can form magnesium phosphate complexes
Reduces P availability despite high soil P
Can interfere with P transport in plants
Physical Damage:
Mg at >15% saturation disperses clay particles
Breaks down soil aggregates
Creates compaction and poor aeration
Even in sandy soil (73.7% sand), this causes crusting and water infiltration problems
Scientific Documentation:
Ros et al. (2017): Mg-K antagonism well-documented
Soil structure dispersion at >15% Mg saturation is established soil physics
ANTAGONISM 3: Potassium ← Calcium, Magnesium (The Squeeze)
The Problem:
K at 2.6% saturation (just barely adequate, needs 4%)
K being squeezed from BOTH sides by excess Ca and Mg
The Mathematics:
Ca excess: 10.8 percentage points above target
Mg excess: 4.8 percentage points above target
Total: 15.6 percentage points taking space K needs
K deficiency: Only 1.4 percentage points below 4% target
K is being crushed by 6× its deficiency amount
Mechanism:
Competitive Inhibition:
Ca²⁺ and Mg²⁺ are divalent cations (2+ charge)
K⁺ is monovalent (1+ charge)
Clay and humus particles hold divalent cations more strongly
K⁺ is displaced and leaches more easily
Transport Competition:
Root membranes have limited K⁺ channels
Ca²⁺ and Mg²⁺ can block these channels
K⁺ uptake severely impaired
Result: Massive K deficiency symptoms:
Marginal necrosis (leaf edge burning)
Weak stems, lodging
Poor fruit quality
Disease susceptibility
Drought sensitivity
Scientific Documentation:
Ros et al. (2017): Ca-K and Mg-K antagonisms among most well-documented
Fan et al. (2021): Molecular mechanisms of competitive inhibition identified
ANTAGONISM 4: Phosphorus → Iron, Zinc, Copper, Manganese
The Problem:
P at 393 ppm (7.9× the 50 ppm target)
Most severe single-element excess in this soil
Mechanism:
P → Fe:
High P forms insoluble FePO₄ (iron phosphate)
Fe precipitates out of solution
Plants show Fe deficiency despite 286 ppm Fe (5.7× target!)
Classic symptom: Interveinal chlorosis on youngest leaves
P → Zn:
Forms Zn₃(PO₄)₂ (zinc phosphate), highly insoluble
Zn lockup despite already having 8.9× target Zn
Reduces Zn availability by orders of magnitude
P → Cu:
Forms Cu₃(PO₄)₂ (copper phosphate)
Contributes to Cu deficiency
Part of the FIVE antagonisms blocking copper in this soil
P → Mn:
High P can induce Mn deficiency
Interferes with Mn transport in plants
Mn:Fe ratio already imbalanced (1:10.6 vs. ideal 2-5:1)
The Compounding Effect: At pH 7.0, phosphate precipitation is maximized. The combination of excess P + high pH creates extremely insoluble micronutrient phosphates.
Scientific Documentation:
Ros et al. (2017): P-Fe, P-Zn antagonisms documented in multiple studies
Formation constants for metal phosphates well-established in soil chemistry literature
ANTAGONISM 5: Iron → Zinc, Copper, Manganese
The Problem:
Fe at 286 ppm (5.7× the 50 ppm target)
Fe:Mn ratio of 10.6:1 (should be 2-5:1), SEVERE
Mechanism:
Fe → Zn:
Competitive inhibition at uptake sites
Fe²⁺ and Zn²⁺ share transport proteins
Excess Fe reduces Zn uptake efficiency
Compounds the Zn:Cu ratio problem
Fe → Cu:
Similar competitive inhibition
Fe²⁺ and Cu²⁺ competition for transporters
Part of the five antagonisms blocking Cu
Fe → Mn:
Most severe in this soil: 10.6:1 ratio
Should be 2-5:1 for optimal function
Both compete for similar biochemical pathways
Mn deficiency symptoms likely despite adequate soil Mn
The pH Effect: At pH 7.0, Fe oxidizes to Fe³⁺ and precipitates as Fe(OH)₃ (rust). Paradoxically, excess Fe becomes unavailable while still blocking other micronutrients.
Scientific Documentation:
Ros et al. (2017): Fe-Zn, Fe-Mn antagonisms well-documented
Fan et al. (2021): Shared transport mechanisms identified
ANTAGONISM 6: Zinc → Iron, Copper, Manganese, Phosphorus
The Problem:
Zn at 44.6 ppm (8.9× the 5 ppm target)
Zn:Cu ratio of 8.58:1 (should be 2-3:1), CLASSIC antagonism
Mechanism:
Zn → Cu:
Most severe antagonism in this soil
8.58:1 ratio means severe competitive inhibition
Zn²⁺ and Cu²⁺ are chemically similar (same charge, similar size)
At 8.9× target Zn, Cu uptake is nearly impossible
Cu deficiency symptoms guaranteed
Zn → Fe:
Bidirectional antagonism with Fe
Each blocks the other
Compounds the micronutrient chaos
Zn → Mn:
Competitive inhibition for transport
Both are essential micronutrients
Excess Zn reduces Mn availability
Zn → P:
Can interfere with P metabolism in plants
Less severe than P → Zn antagonism, but present
Common Symptoms of Zn:Cu Imbalance:
Severe Cu deficiency: Powdery mildew susceptibility, terminal bud die-back
Poor pollen viability and seed set
Pale, limp new growth
Scientific Documentation:
Ros et al. (2017): Zn-Cu antagonism is one of most well-documented in literature
8:1 ratio is considered severe antagonism threshold
ANTAGONISM 7: High pH → Iron, Manganese, Zinc, Copper, Phosphorus
The Problem:
pH jumped from 5.3 → 7.0 (1.7 units)
Zero hydrogen buffering (H: 36% → 0%)
Soil chemistry is "frozen" at pH 7.0
Mechanism:
pH 7.0 Chemical Lockup:
At pH 7.0, micronutrients precipitate as insoluble hydroxides:
Fe³⁺ + 3OH⁻ → Fe(OH)₃ (rust, completely insoluble)
Mn²⁺ + 2OH⁻ → Mn(OH)₂ (insoluble)
Zn²⁺ + 2OH⁻ → Zn(OH)₂ (insoluble)
Cu²⁺ + 2OH⁻ → Cu(OH)₂ (insoluble)
Combined with excess P:
FePO₄, Zn₃(PO₄)₂, Cu₃(PO₄)₂, Mn₃(PO₄)₂ (all insoluble)
Result: Nutrients are chemically locked up. They exist in soil but are unavailable to plants.
The Buffering Catastrophe:
Native soil: 36% H, providing buffering capacity
Can adjust to amendments
Can self-correct minor pH shifts
Has "room" for nutrient movement
Compost-amended soil: 0% H, zero buffering
100% base saturation = completely full
Can't adjust or self-correct
Amendments don't work properly
pH is locked at 7.0
This is the most critical problem because it prevents the soil from healing itself.
Scientific Documentation:
pH-dependent nutrient availability is fundamental soil chemistry
Solubility product constants (Ksp) for metal hydroxides well-established
Buffering capacity theory is basic soil science
The Cascade Effect: How Antagonisms Compound
The seven antagonisms don't act independently—they create a cascade of nutrient lockout.
Example: Copper Deficiency
Soil copper: 5.2 ppm (adequate)
Why plants can't access it:
Magnesium excess (16.8%) → blocks Cu²⁺ uptake at root membrane
Zinc excess (44.6 ppm, 8.6:1 ratio) → competitive inhibition, SEVERE
Iron excess (286 ppm) → interferes with Cu transport
Phosphorus excess (393 ppm) → forms Cu₃(PO₄)₂, insoluble
High pH (7.0) → Cu(OH)₂ precipitation, chemical lockup
FIVE antagonisms blocking one nutrient.
Adding copper fertilizer won't help—the blockages must be removed first.
Molecular Biology of Nutrient Interactions
Transport Protein Competition
At the molecular level, nutrient antagonisms occur because:
Shared Transporters:
IRT1 transporter: moves Fe²⁺, Zn²⁺, Mn²⁺, Cd²⁺
ZIP family: moves Zn²⁺, Fe²⁺, Mn²⁺
COPT family: moves Cu⁺, Cu²⁺
HAK/KUP family: moves K⁺ (can be blocked by Ca²⁺, Mg²⁺)
Competitive Kinetics: When multiple ions compete for the same transporter:
Higher concentration = preferential binding
Similar ionic radius = stronger competition
Same charge state = direct competition
Example: Zn-Cu Antagonism
Both are divalent cations (2+)
Similar ionic radii (Zn²⁺: 0.74 Å, Cu²⁺: 0.73 Å)
Compete for same transport proteins
At 8.9× excess Zn, Cu transport is blocked
Gene Expression Regulation
Nutrients regulate each other's uptake genes:
Phosphorus Excess:
Down-regulates PHO1 (phosphate transporter)
Down-regulates IRT1 (iron transporter)
Result: P excess causes Fe deficiency at genetic level
Iron Status:
Regulates ZIP, IRT, and FRO genes
Excess Fe down-regulates uptake genes for Zn, Mn
Creates homeostatic feedback that blocks other metals
Zinc-Iron Cross-Talk:
Zn status affects expression of Fe transporters
Fe status affects expression of Zn transporters
Bidirectional genetic regulation
Citation: Fan et al. (2021), "Cross-Talks Between Macro- and Micronutrient Uptake and Signaling in Plants," Frontiers in Plant Science
Biochemical Interference
Enzymatic Cofactors:
Many enzymes require specific metal cofactors:
Copper enzymes: Cytochrome c oxidase, Cu/Zn-SOD, plastocyanin
Iron enzymes: Catalase, peroxidase, nitrogenase, ferredoxin
Zinc enzymes: Carbonic anhydrase, alcohol dehydrogenase
Manganese enzymes: Mn-SOD, photosystem II
When antagonisms block cofactor availability:
Enzymes can't function
Metabolic pathways shut down
Visible deficiency symptoms appear
Example: Cu deficiency in this soil:
Cytochrome c oxidase fails → respiration impaired
Plastocyanin fails → photosynthesis impaired
Cu/Zn-SOD fails → oxidative stress increases
Lignin synthesis fails → weak cell walls, disease susceptibility
All from antagonisms blocking adequate Cu, despite 5.2 ppm in soil.
Biological Collapse: Complete Analysis
The pH Shock: 5.3 → 7.0
1.7-unit pH increase = biological catastrophe
Fungal Population Collapse
Optimal fungal pH: 5.0-6.5
At pH 7.0:
Saprophytic fungi (decomposers) decline sharply
Mycorrhizal fungi (plant symbionts) are stressed
Fungal:Bacterial ratio crashes
Specialized lignin decomposers are lost
Specific Losses:
Decomposer Fungi:
Trichoderma spp. (cellulose decomposition) prefer pH 4.0-6.0
Aspergillus spp. (various substrates) prefer pH 5.0-6.0
Penicillium spp. (organic acids production) prefer pH 4.0-6.0
Mycorrhizal Fungi:
Arbuscular mycorrhizae prefer pH 5.5-7.0 (stressed at 7.0)
Ectomycorrhizae prefer pH 4.0-6.0 (lost at 7.0)
Consequence: Loss of fungal "glue" (glomalin) that binds soil aggregates, exacerbating structural damage from Mg dispersion.
Fungal:Bacterial Ratio Shift
Native soil (pH 5.3): Likely balanced F:B ratio (estimated 0.5-1.0:1)
Compost-amended (pH 7.0): Bacteria-dominated (estimated F:B < 0.3:1)
Why this matters:
Fungi build stable soil structure through hyphal networks
Fungi access nutrients from complex organic matter
Fungi form symbioses with plant roots (mycorrhizae)
Bacteria dominate in degraded, bacterial-dominated soils
CDFA 2023 Connection: California's Soil Microbiology Assessment Framework defines functional biology including F:B ratios. This soil would fail biological metrics.
Loss of Specialized Decomposers
Complex substrate decomposers require specific pH ranges:
Lignin degradation: Requires acid-tolerant fungi
White-rot fungi (Phanerochaete, Trametes): pH 4.0-6.0
Brown-rot fungi: pH 4.0-5.5
Lost at pH 7.0
Chitin degradation: Requires chitinolytic organisms
Many prefer acidic conditions
Efficiency drops sharply above pH 6.5
Recalcitrant compound breakdown:
Humic acid formation requires specific microbial consortia
pH 7.0 disrupts community structure
Decomposition slows dramatically
Result: 11.5% organic matter that accumulates but doesn't actively cycle.
Structural Damage Creates Biological Death Zones
Magnesium Dispersion (16.8% saturation)
Physical Process:
Mg²⁺ causes clay plates to separate
Soil aggregates break down
Pore spaces collapse
Air can't penetrate
Biological Consequence:
Aerobic Microbe Suffocation:
Beneficial decomposers need oxygen
Pseudomonas, Bacillus, Streptomyces die
Enzyme production stops
Nutrient cycling halts
Anaerobic Bacteria Take Over:
Clostridium spp. produce toxic organic acids
Sulfate-reducing bacteria produce H₂S (toxic)
Denitrifiers produce N₂O (greenhouse gas)
Alcohols and aldehydes accumulate
Redox Potential Drops:
Low oxygen = low redox (Eh)
Favorable for pathogens
Soil-borne diseases increase
Root rot risk elevated
The Compounding Effect of Lost Mycorrhizae
Mycorrhizae produce glomalin:
Glycoprotein that binds soil particles
Creates stable aggregates resistant to dispersion
"Glue" that holds soil structure together
When pH kills mycorrhizae:
Glomalin production stops
Existing glomalin degrades
Soil aggregates become even more vulnerable to Mg/Na dispersion
Feedback loop: Structure → biology → structure → biology
Nutrient Starvation of Microbes
Microbes need balanced nutrition to function:
Copper Deficiency Impacts:
Lignin peroxidase requires Cu cofactor
Without Cu, lignin decomposition stops
Wood and complex plant residues accumulate undecomposed
Iron Lockup Impacts:
Cytochrome enzymes require Fe
Aerobic respiration impaired in microbes
Energy production limited
Population growth suppressed
Potassium Deficiency Impacts:
K required for microbial cell membrane integrity
K-deficient microbes have weakened cells
Osmotic stress increases
Survival and reproduction compromised
Manganese Imbalance Impacts:
Mn required for oxidation-reduction reactions
Mn-SOD (superoxide dismutase) protects against oxidative stress
Without Mn, microbes suffer oxidative damage
The cruel irony: Microbes trying to decompose organic matter are nutritionally crippled by the same antagonisms blocking plants.
Organic Matter: High Quantity, Low Function
11.5% organic matter = impressive number
But biological activity is severely reduced:
Decomposition rate slows:
Limited microbial populations
Nutrient deficiencies in decomposers
Anaerobic conditions inhibit aerobic breakdown
Complex substrates accumulate
Nutrient release stops:
N, P, S locked in dead organic matter
Microbes can't mineralize nutrients
Plants can't access organically-bound nutrients
Humus formation halts:
Requires active microbial communities
Needs balanced chemistry
pH 7.0 disrupts humic acid synthesis
Organic matter accumulates but doesn't stabilize
CEC becomes meaningless:
Exchange sites exist (28.6 meq/100g)
But nutrients are locked in antagonisms
High CEC, low function
This soil is a graveyard, not an ecosystem.
CDFA 2023 Biological Metrics: Predicted Failures
California now defines functional soil biology with measurable standards:
Microbial Biomass:
Target: >400 μg C/g soil
This soil: Likely <250 μg C/g (reduced populations)
FAIL
Fungal:Bacterial Ratio:
Target: 0.5-1.0:1 for agricultural systems
This soil: Likely <0.3:1 (bacteria-dominated)
FAIL
Microbial Diversity:
Target: Shannon diversity index >3.5
This soil: Likely <2.5 (pH shock reduced diversity)
FAIL
Functional Gene Abundance:
Targets for N-cycling, P-solubilizing, C-cycling genes
This soil: Reduced across multiple functional groups
FAIL
The bottom line: This soil would fail California's 2030 biological verification standards despite having "high organic matter."
Structural Damage Chemistry
Magnesium Dispersion Mechanism
Why Mg causes clay dispersion:
Clay Particle Behavior:
Clay plates have negative charge
Held together by cations bridging between plates
Ca²⁺ creates strong, stable bridges (divalent, large hydration shell)
Mg²⁺ has smaller hydration shell → weaker bridges
At >15% Mg saturation:
Mg²⁺ replaces Ca²⁺ on exchange sites
Weaker bridges allow clay plates to separate
Clay particles disperse into solution
Pore spaces fill with dispersed clay
Structure collapses
Even in sandy soil:
Clay-sized particles from organic amendments
Organo-mineral complexes contain clay
Sufficient fine particles to create dispersion problems
Sodium Compounding Effect
Location B Na at 114 ppm (Location A native had only 11 ppm - 10× increase):
Sodium Adsorption Ratio (SAR): SAR = Na / √((Ca + Mg)/2)
High SAR indicates dispersion risk
Na⁺ is monovalent with very small hydration shell
Even worse than Mg²⁺ for dispersion
The Mg + Na combination:
16.8% Mg + 114 ppm Na
Synergistic dispersion effect
Creates semi-permanent structural damage
Correction requires displacing both
Physical Manifestations
Surface Crusting:
After rain, dispersed clay seals surface
Hard crust forms on drying
Seedling emergence impaired
Water can't infiltrate
Compacted Layers:
Subsurface dispersion creates dense zones
Roots can't penetrate
Water movement blocked
Anaerobic conditions develop
Poor Water Infiltration:
Water sits on surface
Runoff increases
Erosion risk elevated
Plants suffer both drought and waterlogging
Reduced Air Movement:
Pore spaces sealed
Gas exchange limited
Root respiration impaired
Beneficial aerobic microbes suffocate
Heavy Metals and Municipal Compost
Important Context: This soil test data does not include heavy metal analysis. The following section addresses general risks associated with municipal compost, not confirmed contamination in this specific case.
Why Heavy Metals Matter
Municipal compost sources can contain:
Biosolids (treated sewage sludge)
Industrial organics
Yard waste from contaminated sites
Food waste from various sources
Animal manure sources can contain:
Arsenic (from poultry feed additives - historical)
Copper and zinc (from swine and poultry feed)
Heavy metals accumulated in animal tissue
Antibiotic residues
Organic fertilizer products can contain:
Industrial byproducts with metal contamination
Mining waste materials
Municipal waste-derived ingredients
Each source carries potential contamination:
Lead (Pb) from old paint, contaminated soil, industrial processes
Cadmium (Cd) from phosphate fertilizers, industrial processes
Arsenic (As) from pressure-treated lumber, pesticides, poultry feed (historical)
Mercury (Hg) from various industrial sources, coal combustion
Chromium (Cr) from leather tanning, industrial processes
Nickel (Ni) from industrial waste, mining operations
Cobalt (Co) from industrial processes
Thallium (Tl) from cement manufacturing, coal combustion
PFAS (per- and polyfluoroalkyl substances) from food packaging, firefighting foam, biosolids
Heavy Metals and Soil Microbes
Critical point: Microbes are MORE sensitive to heavy metals than plants.
Parts-per-billion toxicity to microbes:
Cadmium (Cd):
Toxic to nitrogen-fixing bacteria at <10 ppb
Disrupts nitrogenase enzyme
Rhizobia populations crash
Legume nitrogen fixation fails
Lead (Pb):
Inhibits microbial enzymes at <50 ppb
Blocks sulfhydryl groups in proteins
Reduces microbial diversity
Decomposition rates decline
Mercury (Hg):
Extremely toxic at ppb levels
Binds to sulfur groups in proteins
Denatures enzymes irreversibly
Microbial populations collapse
Arsenic (As):
Blocks phosphate metabolism
Interferes with ATP synthesis
Toxic to most microbes at low concentrations
The Hidden Danger
Soil can pass plant tissue testing:
Plants may show acceptable metal levels
Crops appear safe for consumption
Regulatory limits not exceeded
But microbiome is destroyed:
Microbial populations severely reduced
Functional diversity lost
Nutrient cycling impaired
Disease-suppressing organisms gone
Result: "Safe" soil by plant standards, non-functional by biological standards.
Vulnerable Populations: Enhanced Risk
Operations serving children, inmates, hospital patients require:
Parts-per-billion testing:
Lead (Pb) - neurotoxin, especially dangerous for children
Cadmium (Cd) - kidney damage, bone disease, carcinogen
Arsenic (As) - carcinogen, neurotoxin, skin lesions
Mercury (Hg) - severe neurotoxin, especially organic forms
Chromium (Cr) - hexavalent form is carcinogenic
Nickel (Ni) - allergenic, potential carcinogen
Cobalt (Co) - thyroid effects, potential carcinogen
Thallium (Tl) - severe neurotoxin, historically used as rat poison
PFAS when available - persistent, bioaccumulative, multiple health effects
Persistent herbicides (aminopyralid, clopyralid, picloram) - damage crops for years
Why vulnerable populations need stricter standards:
Direct soil contact (skin absorption)
Incidental ingestion (hand-to-mouth, dust)
Consumption of bioaccumulating crops
Higher sensitivity to contaminants
This is NOT optional for school gardens, prison farms, hospital agriculture.
The Testing Gap
Current regulatory frameworks have gaps:
No standardized ppb testing protocols for agricultural soil
No clear safety standards for compost in vulnerable population settings
No systematic training for contamination management
ORCA is developing curriculum to address these gaps (R&D stage)
Heavy Metals: Effects on Plant Physiology and Genetic Expression
IMPORTANT CONTEXT: Neither Location A nor Location B soil tests included heavy metals analysis. This section provides essential background on heavy metal antagonisms and plant effects that apply to ANY agricultural operation using organic inputs from unknown sources.
Why This Matters for Soil Chemistry
Heavy metals don't just threaten human health—they fundamentally alter plant physiology and create additional nutrient antagonisms on top of those from elemental imbalances. Understanding heavy metal effects is critical for:
Operations using municipal compost or biosolids
Farms with unknown contamination history
Vulnerable population settings (schools, prisons, hospitals)
Cannabis cultivation (hyperaccumulator species)
How Heavy Metals Suppress Plant Genetic Expression
The Gene Silencing Mechanism:
Heavy metals modify gene expression at transcriptional and post-transcriptional levels through multiple mechanisms including reactive oxygen species generation, calcium flux disruption, phytohormone interference, and epigenetic modifications.
Three Ways Heavy Metals Alter Plant Genetics:
1. Direct DNA Damage
Mercury, lead and arsenic are effective mitotic poisons due to their affinity for thiol groups and induce spindle disturbances during cell division
Arsenic can replace phosphorus in phosphate groups of DNA
Result: Plants can't express their full genetic potential
The plant has the genes but can't use them
2. Epigenetic Modifications
Plants respond to heavy metal stress through epigenetic mechanisms that regulate gene expression through chemical modifications of DNA, histones, and regulatory RNAs
DNA methylation patterns change
Histone modifications occur
MicroRNA expression altered
These changes can be passed to next generation—stressed plants produce stressed offspring
3. Gene Expression Reprogramming
Heavy metal stress leads to altered expression of stress-responsive genes
Growth genes downregulated
Yield genes suppressed
Quality genes silenced
Defense genes upregulated
Plant diverts ALL energy to survival, not production
The Result: Plant has its full genetic code for high yield, nutrition, flavor, and quality—but can't express those genes under heavy metal stress.
Molecular Mechanisms of Heavy Metal Toxicity
Heavy metals use the same transport systems as essential nutrients, which explains both how they enter plants and why they're so toxic.
Heavy Metal Uptake Through Nutrient Transporters
IRT1 (Iron-Regulated Transporter 1) - The Gateway for Multiple Heavy Metals:
Primary target: Fe²⁺
Also transports: Cd²⁺, Zn²⁺, Mn²⁺
Cadmium entry mechanism: Cd²⁺ ionic radius similar to Zn²⁺ and Fe²⁺
When soil Cd present + Fe deficiency → IRT1 upregulated → MORE Cd enters
Why Fe deficiency is dangerous: Opens door to Cd, Pb toxicity
ZIP Transporters - Multi-Metal Entry Points:
ZIP1, ZIP2, ZIP3, ZIP4 all transport heavy metals
Cd²⁺ uses: ZIP1, ZIP2, ZIP3, ZIP4 (very promiscuous)
Pb²⁺ can use some ZIP transporters
Competitive relationships:
Adequate Zn → reduces Cd uptake (Zn outcompetes Cd for ZIPs)
Zn deficiency → more Cd uptake (ZIPs upregulated, Cd enters freely)
NRAMP Transporters:
NRAMP1, NRAMP3 transport Cd²⁺, Mn²⁺, Fe²⁺
Cd toxicity mechanism: Cd²⁺ enters through Mn/Fe transporters
Once inside vacuole, NRAMP3/4 release Cd to cytoplasm
High Mn or Fe status can reduce Cd transport
Calcium Channels - Lead Entry:
Pb²⁺ ionic radius similar to Ca²⁺
Enters through: Voltage-gated Ca²⁺ channels, NSCCs (non-selective cation channels)
Why Ca deficiency increases Pb toxicity: Ca channels upregulated, more Pb enters
Competitive exclusion: High Ca blocks Pb entry
Phosphate Transporters - Arsenate Entry:
AsO₄³⁻ (arsenate) is chemical mimic of PO₄³⁻
Enters through: PHT1 family transporters
Plant cannot distinguish arsenate from phosphate
Why P adequacy helps: Saturates PHT1 transporters, less room for arsenate
Heavy Metal Transport WITHIN Plant (The Distribution Problem)
Once inside root, heavy metals must move to shoots via xylem:
HMA Family (Heavy Metal ATPases) - The Intentional Transporters:
HMA2, HMA4: Normally transport Zn²⁺ from root to shoot
Also transport Cd²⁺ - plant's Zn machinery used against it
Cannabis: High HMA expression = hyperaccumulator (concentrates Cd in shoots)
MATE Transporters (Multidrug and Toxic Compound Extrusion):
Normally sequester metals in vacuoles (detoxification)
Citrate-metal complexes transported
Cd-citrate, Pb-citrate complexes sequestered
But finite capacity - overwhelmed by high contamination
PCR (Plant Cadmium Resistance proteins):
PCR1, PCR2 in rice
Reduce Cd translocation to grain
Mechanism: Keep Cd in roots, prevent shoot accumulation
Some plants lack effective PCR → more Cd in edible parts
Molecular Mechanisms of Toxicity
1. Thiol Group Binding (Mercury, Lead, Cadmium, Arsenic)
The Chemistry:
Heavy metals have extreme affinity for sulfur
Thiol groups (-SH) in cysteine, methionine, glutathione
Binding constant (Kd) for Hg-thiol: 10⁻²⁴ M (essentially irreversible)
Enzyme Destruction:
Most enzymes contain cysteine in active site
Heavy metal binds -SH group → enzyme inactivated
Examples:
Rubisco: Contains cysteine → Cd, Pb bind → photosynthesis stops
Nitrate reductase: Cd binds to -SH groups → N assimilation stops
Alcohol dehydrogenase: Hg binds → cellular respiration impaired
Glutathione Depletion:
Glutathione (GSH) = plant's master antioxidant (contains 3 -SH groups)
Heavy metals bind GSH, depleting cellular stores
Cd + GSH → Cd-GS₂ complex
Result: Oxidative stress (no antioxidant protection)
Protein Cross-Linking (Mercury Specialty):
Hg²⁺ can bind TWO thiol groups simultaneously
Creates protein-Hg-protein cross-links
Denatures protein structure
At high Hg, proteins precipitate (complete loss of function)
2. Phosphate Mimicry (Arsenic)
The Deception:
Arsenate (AsO₄³⁻) has same charge, similar geometry as phosphate (PO₄³⁻)
Plant biochemistry cannot distinguish them
ATP Becomes "ADP-As" (Defective Energy Currency):
Normal: ADP + Pi + energy → ATP (adenosine triphosphate)
With arsenate: ADP + AsO₄ → "ADP-As" (adenosine diphosphate arsenate)
ADP-As is unstable - spontaneously hydrolyzes
No energy storage - plant makes "money" that immediately evaporates
Arsenic in DNA:
AsO₄³⁻ can replace PO₄³⁻ in DNA backbone
Creates unstable phosphodiester bonds
DNA strand breaks
Mutagenic effects, genomic instability
Sugar Metabolism Disruption:
Glucose-6-phosphate + arsenate → glucose-6-arsenate
Arsenate esters are unstable
Glycolysis fails - plant can't metabolize sugars for energy
3. Calcium Mimicry (Lead)
Similar Ionic Radius:
Pb²⁺: 119 pm
Ca²⁺: 100 pm
Close enough to bind Ca-binding proteins
Calmodulin Dysfunction:
Calmodulin = Ca²⁺-sensing protein (cellular signaling)
Pb²⁺ binds to Ca²⁺ sites on calmodulin
But doesn't trigger proper conformational change
Signaling cascade blocked
PKC (Protein Kinase C) Inhibition:
PKC requires Ca²⁺ for activation
Pb²⁺ binds but creates non-functional PKC
Cell signaling paralyzed
Mitochondrial Damage:
Ca²⁺ regulates mitochondrial function
Pb²⁺ enters mitochondria through Ca²⁺ channels
Disrupts electron transport chain
Cellular energy production fails
4. Zinc/Iron Mimicry (Cadmium)
Cd²⁺ Binding to Metallothionein:
Metallothionein (MT) = Zn/Cu storage protein
Cd²⁺ binds more tightly than Zn²⁺ to MT thiol groups
Displaces Zn from MT
Result: Zn deficiency symptoms despite adequate Zn
Enzyme Active Sites:
Many enzymes require Zn cofactor
Cd can occupy Zn-binding sites
But Cd doesn't activate enzyme (wrong electronic configuration)
Enzyme rendered non-functional
Example - Carbonic Anhydrase:
Requires Zn²⁺ cofactor
Cd²⁺ can substitute but enzyme is inactive
Photosynthesis impaired (CA needed for CO₂ fixation)
Gene Expression Changes Under Heavy Metal Stress
WRKY Transcription Factors:
WRKY family activated by heavy metal stress
Upregulate: Stress response genes, glutathione synthesis, metallothionein
Downregulate: Growth genes, yield genes
Defense-growth trade-off at molecular level
Specific Gene Responses:
Cd Stress:
↑ MT genes (metallothionein) - bind and sequester Cd
↑ PCS genes (phytochelatin synthase) - make Cd-binding peptides
↑ ABC transporters - pump Cd-PC complexes into vacuole
↓ Photosynthesis genes (RBCS, RBCL, CAB) - growth suppressed
As Stress:
↑ OsNCED2, OsNCED3 (ABA biosynthesis) - stress hormone response
↑ Antioxidant genes (SOD, CAT, APX) - combat oxidative stress
↓ Auxin biosynthesis genes - growth suppressed
↓ PHO1, PHT1 transporters - P metabolism altered
Pb Stress:
↑ Heat shock proteins (HSP70, HSP90) - protein damage repair
↑ Glutathione S-transferase - detoxification
↓ AKT1, HAK5 (K⁺ transporters) - nutrient uptake impaired
↓ IRT1 (Fe transporter) - paradoxically worsens Fe deficiency
Hg Stress:
↑ Mercuric reductase (MERA) in resistant species - converts Hg²⁺ → Hg⁰ (volatile)
↑ Metallothionein genes
↓ Nearly all metabolic genes - severe growth suppression
Hg is most toxic - broadest gene expression shutdown
Epigenetic Modifications (Multi-Generational Effects)
DNA Methylation Changes:
Heavy metal stress alters methylation patterns
CG, CHG, CHH methylation at stress-responsive loci
Example: Cd stress increases methylation at growth gene promoters
Result: Growth genes permanently silenced (even after Cd removed)
Histone Modifications:
H3K4me3 (histone 3 lysine 4 trimethylation) - activating mark
H3K27me3 (histone 3 lysine 27 trimethylation) - repressive mark
Heavy metals shift balance toward repressive marks
Growth genes get H3K27me3 → locked in "off" state
Transgenerational Inheritance:
Epigenetic changes can pass through meiosis
Stress-exposed parent → offspring with altered gene expression
Offspring show stress phenotype without direct exposure
Takes 2-3 generations to "reset" after contamination removed
MicroRNA Changes:
miR398: Normally suppresses Cu/Zn-SOD
Under Cu stress: miR398 downregulated → more SOD (compensatory)
Under Cd stress: miR398 upregulated → less SOD → more oxidative damage
miR167, miR393: Regulate auxin signaling → altered under Pb stress
Reactive Oxygen Species (ROS) - The Central Damage Mechanism
Why Heavy Metals Generate ROS:
Fenton Reaction (Fe, Cu, Cr):
Fe²⁺ + H₂O₂ → Fe³⁺ + OH• + OH⁻
Cu⁺ + H₂O₂ → Cu²⁺ + OH• + OH⁻
OH• (hydroxyl radical) = extremely reactive
Attacks DNA, proteins, lipids
Direct Electron Transfer:
Heavy metals can accept/donate electrons
Interferes with electron transport chains
Creates superoxide (O₂•⁻), hydrogen peroxide (H₂O₂)
Glutathione Depletion:
Heavy metals bind GSH → depleted antioxidant capacity
Existing ROS can't be neutralized
Cascading oxidative damage
ROS Damage Types:
Lipid Peroxidation:
ROS attack membrane lipids
Creates lipid peroxides, aldehydes (MDA, 4-HNE)
Membrane integrity lost
Ion leakage, cell death
Protein Carbonylation:
ROS add carbonyl groups to proteins
Proteins misfold, aggregate, lose function
Widespread enzyme failure
DNA Damage:
8-oxo-guanine formation (mutagenic)
Strand breaks
Genomic instability, mutations
Antioxidant Defense System Response
Plants upregulate antioxidant enzymes:
SOD (Superoxide Dismutase):
O₂•⁻ + O₂•⁻ + 2H⁺ → H₂O₂ + O₂
Removes superoxide radical
But requires proper Zn:Cu or Mn:Fe ratios
Heavy metals disrupt these ratios → SOD impaired
CAT (Catalase):
2H₂O₂ → 2H₂O + O₂
Removes hydrogen peroxide
Contains heme (Fe-porphyrin)
Cd, Pb can displace Fe → CAT inactivated
APX (Ascorbate Peroxidase):
H₂O₂ + ascorbate → H₂O + dehydroascorbate
Alternative H₂O₂ removal
Requires ascorbate (vitamin C)
Heavy metals deplete ascorbate → APX ineffective
The Paradox:
Plants upregulate antioxidant genes under heavy metal stress
But heavy metals impair the enzymes themselves
Defense system overwhelmed
Oxidative damage continues despite antioxidant response
Plant Physiological Effects
1. Photosynthesis Destruction
Heavy metals interfere with chlorophyll biosynthesis and damage photosystem II, leading to decreased photosynthetic rate. Cadmium and lead are particularly recognized for hindering CO₂ fixation and degrading chlorophyll.
Specific mechanisms:
Chloroplasts structurally damaged
Rubisco enzyme (CO₂ fixation) inhibited
Chlorophyll degraded (plants turn yellow)
Photosystem II damaged
Field symptoms:
Pale green to yellow leaves (chlorosis)
Interveinal chlorosis
Poor vigor despite adequate light
Reduced biomass
2. Oxidative Stress
Heavy metals increase production of reactive oxygen species (ROS), causing oxidative stress and damage to cellular components including lipids, proteins, and DNA.
What happens:
Cell membranes deteriorate
Proteins denature
Enzymes stop working
Like rusting from the inside out
3. Root Development Failure
Heavy metals inhibit seed germination and root elongation due to osmotic stress and cell membrane damage, impairing water uptake and reducing essential hydrolytic enzyme activity.
Observable effects:
Poor seed germination
Stunted root systems
Shallow rooting
Poor water/nutrient uptake even from good soil
4. Hormone Disruption
Heavy metal stress leads to decreased endogenous levels of auxins while increasing ABA levels.
Hormonal imbalance effects:
Auxins (growth hormones) ↓ suppressed
ABA (stress hormone) ↑ elevated
Plant locked in "survival mode"
No resources allocated to yield/quality
Metal-Specific Effects on Plants
CADMIUM (Cd) - "The Zinc Impersonator"
Primary Mechanism:
Cadmium competes with zinc for binding sites on metallothionein
Cd replaces Zn in key enzymes
Interferes with Cu, Zn, Fe metabolism
Specific damage:
Chlorophyll degradation (yellow plants)
Looks like zinc deficiency even with adequate Zn
Cannabis plants are hyperaccumulators—concentrate Cd from soil
Why dangerous:
Easy uptake from soil (mobile)
Accumulates in edible parts
No warning symptoms until severe
LEAD (Pb) - "The Calcium Mimic"
Primary Mechanism:
Lead competes with calcium for uptake sites
Blocks calcium transport
Interferes with cell signaling
Specific damage:
Replaces Ca in cell membranes
Impairs cell wall formation
Disrupts nutrient transport
Plant thinks lead IS calcium—uses it wrong
Agricultural impact:
Reduced germination rates
Stunted seedlings
Weakened cell walls (disease susceptibility)
ARSENIC (As) - "The Phosphorus Pretender"
Primary Mechanism:
Due to chemical similarity to phosphorus, arsenic participates in many cell reactions
Arsenic can replace phosphorus in phosphate groups of DNA
Specific damage:
Disrupts ATP (energy) production
Interferes with phosphorylation reactions
Damages photosynthetic pigments
Plant makes broken "energy" molecules using As instead of P
Field observations:
Reduced growth despite adequate P fertilization
Chloroplast damage
Poor protein synthesis
Disturbed nutrient balance
MERCURY (Hg) - "The Protein Destroyer"
Primary Mechanism:
Mercury ion binds to sulfur groups (-SH) on proteins
Extreme affinity for sulfhydryl groups
Can bind protein chains together or precipitate proteins
Specific damage:
Destroys enzyme function
Precipitates proteins (makes them useless)
Disrupts sulfur metabolism
Every enzyme with sulfur = destroyed
Agricultural consequences:
Enzyme systems fail
Metabolic processes stop
Poor sulfur metabolism
Protein synthesis impaired
Heavy Metal-Nutrient Antagonisms (Protective)
CRITICAL INSIGHT: The same nutrient antagonisms that cause problems in imbalanced soil can PROTECT against heavy metal uptake when nutrients are adequately balanced.
IRON (Fe) - The First Defense
Iron and heavy metals have antagonistic relationships:
Adequate Fe BLOCKS Cd, Pb, Al, As uptake at the root
Fe deficiency = increased absorption of cadmium, lead, and aluminum
Iron competes with arsenic (sufficient iron mitigates arsenic toxicity)
Why Fe:Mn ratio matters:
Location B has Fe:Mn ratio of 10.6:1 (target 2-5:1)
Excess Fe relative to Mn
But still protective against heavy metals IF they were present
Balance is key—adequate Fe without excess
CALCIUM (Ca) - Lead Blocker
Calcium competes with lead:
Ca deficiency increases lead absorption and retention
Adequate Ca blocks Pb entry at uptake sites
BUT excess Ca creates other problems (Location B: 78.8%)
Need target range (68%), not "more is better"
ZINC (Zn) - Cadmium Competitor
Zinc and cadmium compete:
Cd competes with Zn for binding on metallothionein
Adequate Zn = less Cd uptake
Zn stimulates plant's natural detox protein (metallothionein)
BUT excess Zn creates Cu problems (Location B: 44.6 ppm, 8.58:1 ratio)
Need adequacy, not excess
SELENIUM (Se) - The Universal Protector
Selenium interacts with heavy metals:
Se binds to Hg (forms Hg-Se complex, neutralizes both)
Se protects against As, Cd toxicity
Beneficial (not essential) for plants
Acts as antioxidant, reduces stress
BUT gets consumed in process—not permanent protection
The Protective Principle:
Heavy metals use same transporters as essential nutrients
Adequate essential nutrients = competitive exclusion
Deficient essentials = open door for toxics
Balanced nutrition is first line of defense
The Defense-Growth Trade-Off
Resource allocation between growth and defense is a key trade-off for plant survival. Under heavy metal exposure, stronger defense responses often coincide with reduced growth, even without visible damage.
What This Means:
Plant has limited energy and can invest in:
(A) Growth, yield, quality OR
(B) Survival, detox, defense
Heavy metals force choice (B).
Gene Expression Shift:
Growth genes: ↓ Downregulated
Defense genes: ↑ Upregulated
Yield genes: ↓ Suppressed
Quality genes: ↓ Suppressed
Detoxification genes: ↑ Maximally expressed
Visible Outcome:
Plants look stressed (chlorotic, stunted)
Produce very little
What they produce is low quality
All energy to detox, zero to production
Example: Heritage Tomato Genetic Expression
Your heritage tomato variety has genes for:
12% sugar content (Brix)
Complex flavor compounds
High lycopene (nutrition)
Disease resistance
Vigorous growth
Same variety in heavy metal contaminated soil:
Sugar: 6% (genes suppressed)
Flavor: Bland (secondary metabolite genes silenced)
Lycopene: 40% of normal (pathway disrupted)
Disease resistance: Weak (defense genes busy with metal stress)
Growth: Stunted (growth genes downregulated)
You're growing a Ferrari with the engine disabled. The genetics are there. The expression is blocked.
Why Heavy Metals Compound Nutrient Imbalances
In a soil like Location B with existing imbalances:
Already present:
Ca excess (78.8%)
Mg excess (16.8%)
P excess (393 ppm)
Zn excess (44.6 ppm)
These create nutrient antagonisms
ADD heavy metal contamination from untested compost:
Fe deficiency from imbalance → Cd, Pb, As enter easily
Cd displaces Zn → worsens already-problematic Zn:Cu ratio
As interferes with P → worsens P-induced micronutrient lockup
Pb competes with Ca → despite Ca excess, plants show Ca deficiency symptoms
Heavy metals COMPOUND existing elemental antagonisms.
This is why testing organic inputs for heavy metals is critical—you may already have antagonism problems from elemental imbalances. Adding heavy metal contamination creates cascading failures.
Management Implications
1. Source Control is Critical
Municipal compost risks:
Biosolids (sewage sludge) = Cd, Pb, Hg source
Industrial organics = potential As, Cd
Street sweepings = Pb from old gasoline
Unknown feedstocks = unknown metals
Animal manure risks:
Arsenic from poultry feed additives (historical)
Copper and zinc from swine/poultry feed
Accumulation in animal tissue
2. Test Before Applying
For any organic input from unknown or municipal sources:
Complete heavy metals panel (Pb, Cd, As, Hg, Cr, Ni, Co, Tl)
Parts-per-billion sensitivity for vulnerable populations
Document results for institutional liability
3. Balanced Nutrition as Protection
Maintain adequate (not excessive) levels of:
Iron (blocks Cd, Pb, As)
Calcium (blocks Pb)
Zinc (competes with Cd, stimulates detox)
Consider selenium supplementation if contamination present
4. Multi-Generational Awareness
Epigenetic changes from heavy metal stress can transmit to offspring:
Contaminated soil → stressed plants
Stressed plants → seeds with altered epigenetics
Next crop → starts with genes already "silenced"
Problem compounds over generations
Connection to This Case Study
Neither Location A nor Location B was tested for heavy metals. This is a gap.
Location B concerns:
Heavy organic amendment program (compost, manure, organic fertilizers)
No documentation of input sources
No heavy metals screening
Already severe nutrient imbalances (7 antagonisms)
Adding heavy metal contamination would create catastrophic compounding
For vulnerable populations: This level of amendment without heavy metals testing would be completely unacceptable in settings serving children, inmates, or hospital patients.
The lesson: Elemental imbalances are bad enough. Heavy metal contamination makes everything worse. Test BOTH.
Correction Protocols
CRITICAL WARNING: Soil correction requires professional guidance. This section is for educational purposes and consultant reference—not DIY implementation.
Why Professional Guidance Is Essential
Soil chemistry is complex:
Multiple elements interact simultaneously
Wrong amendments create new problems
Sequential steps must be followed precisely
Monitoring during correction is critical
Example of what can go wrong:
Farmer sees high Ca, adds sulfur to lower pH:
Sulfur does lower pH
But doesn't displace Ca
Now have low pH + high Ca = worse antagonisms
Micronutrient availability destroyed further
Farmer sees Mg excess, adds dolomite (CaMg) thinking "calcium displaces magnesium":
Actually adds MORE Mg
Makes problem catastrophically worse
Both Ca and Mg now excessive
General Correction Principles
These are principles, not prescriptions:
Phase 1: Stop Making It Worse
Cease all compost applications until chemistry is corrected
No additional Ca, Mg, P, Zn loading
Gives soil time to stabilize
Prevents further accumulation
Test any future amendments before application
Complete elemental analysis
Not just N-P-K
Know what's going IN
Phase 2: Restore Buffering Capacity
Critical first step: Restore hydrogen percentage
Methods include:
Elemental sulfur (slow, converts to H₂SO₄)
Acidifying fertilizers (ammonium sulfate, etc.)
Organic acids (humic, fulvic)
Sulfuric acid (professional application only)
Goal: Get H back to 10-15% range
Unlocks pH from 7.0
Allows other corrections to work
Restores soil's ability to adjust
Timeline: 6-12 months depending on method
Phase 3: Displace Excess Calcium
This is where gypsum discussions belong:
Gypsum (CaSO₄·2H₂O):
Provides Ca²⁺ AND SO₄²⁻
Flocculates dispersed clay (immediate structural benefit)
SO₄²⁻ pairs with excess Ca²⁺ in soil solution
CaSO₄ is soluble and leaches, carrying excess Ca with it
The 3-step process:
Gypsum application → Ca²⁺ and SO₄²⁻ in solution
SO₄²⁻ binds soil Ca²⁺ → CaSO₄ forms
CaSO₄ leaches with irrigation/rain → Ca is removed
Application rates: Calculated based on:
Excess Ca amount
CEC
Soil texture (leaching capacity)
Irrigation/rainfall
Timeline: Multiple applications over 12-24 months
BUT: This is also why DIY is dangerous. If you apply gypsum to a soil that needs Ca, you make it worse. Professional calculation essential.
Phase 4: Address Magnesium
Mg is harder to displace than Ca:
Strategies:
Gypsum also helps displace Mg (Ca²⁺ exchanges for Mg²⁺)
Potassium sulfate can help (K⁺ + SO₄²⁻)
Ammonium-based fertilizers (NH₄⁺ competes with Mg²⁺)
Physical leaching in sandy soils
Timeline: 18-24 months, often longer
Phase 5: Balance K, Micronutrients
Once Ca, Mg, pH, buffering are corrected:
Potassium:
Can now be added without being blocked
Potassium sulfate preferred (adds K and S, no Cl)
Goal: 4% saturation
Micronutrients:
Chelated forms may be needed initially (bypass pH issues)
Sulfate forms preferred for long-term
Foliar applications for immediate deficiency relief
Soil applications for sustained correction
Iron:
Iron sulfate (FeSO₄·7H₂O)
Chelated Fe (Fe-EDDHA) for immediate relief
Zinc:
Actually excessive at 44.6 ppm
No addition needed
May need to avoid Zn sources for years
Copper:
Copper sulfate (CuSO₄·5H₂O)
But must wait until Zn is reduced
Otherwise just blocked by 8.9× Zn excess
Manganese:
Manganese sulfate (MnSO₄)
Once Fe:Mn ratio is corrected
Phase 6: Rebuild Biological Function
After chemistry is improving:
Inoculate with beneficial organisms:
Mycorrhizal fungi appropriate for pH range
Compost tea (from known, tested source)
Cover crops to feed rebuilding biology
Feed the biology:
Low-impact organic matter (not more compost!)
Cover crop residues
Root exudates from living plants
Monitor biological recovery:
Microbial biomass testing
F:B ratio assessment
Functional diversity analysis
Timeline: 2-5 years for full biological recovery
Monitoring During Correction
Annual testing minimum:
Full chemistry panel
pH and buffer pH
Base saturation percentages
Key ratios
Watch for:
pH movement
Hydrogen percentage recovery
Ca and Mg declining
K becoming available
Micronutrient ratios improving
Adjust strategy based on results — soil correction is iterative, not prescriptive.
Realistic Timeline
Total correction timeline: 3-5 years
Year 1:
Restore buffering capacity
Begin Ca displacement
Emergency foliar micronutrients for crops
Year 2-3:
Continue Ca/Mg displacement
Balance K
Begin micronutrient soil applications
Biological rebuilding starts
Year 4-5:
Fine-tune ratios
Full biological recovery
System becomes self-regulating
This is why prevention through testing is critical. Correction takes years. Prevention takes one soil test.
Complete Scientific References
Nutrient Interaction Research
Ros, G. H., Hanegraaf, M. C., Hoffland, E., & van Riemsdijk, W. H. (2017). "Effects of Nutrient Antagonism and Synergism on Yield and Fertilizer Use Efficiency." Communications in Soil Science and Plant Analysis, 48(16), 1895-1920.
Meta-analysis of 94 peer-reviewed studies
Documented 117 nutrient interactions (43 synergistic, 17 antagonistic, 35 zero effect)
Quantified effects on crop yield and nutrient use efficiency
Established that antagonisms particularly common among divalent cations
Fan, X., Zhou, X., Chen, H., Tang, M., & Xie, X. (2021). "Cross-Talks Between Macro- and Micronutrient Uptake and Signaling in Plants." Frontiers in Plant Science, 12, 663477.
Molecular biology research on P-Zn-Fe interactions
Identified transport proteins and genetic regulation mechanisms
Documented gene expression changes in response to nutrient status
Showed bidirectional regulation between competing nutrients
Soil Chemistry Fundamentals
Albrecht, W.A. (1975). The Albrecht Papers, Volume I-IV. Acres USA.
Foundation of base cation saturation ratio theory
Ideal Ca:Mg:K ratios for optimal plant growth
Connection between soil chemistry and crop quality
Empirical data from decades of field trials
Tisdale, S.L., Nelson, W.L., Beaton, J.D., & Havlin, J.L. (2005). Soil Fertility and Fertilizers: An Introduction to Nutrient Management (7th ed.). Pearson.
Standard textbook on soil fertility
Nutrient availability by pH
Cation exchange capacity theory
Solubility products for precipitates
Soil Microbiology
Fierer, N. (2017). "Embracing the unknown: disentangling the complexities of the soil microbiome." Nature Reviews Microbiology, 15, 579-590.
Overview of soil microbial ecology
Factors affecting microbial community composition
pH as primary driver of microbial diversity
Rousk, J., Bååth, E., Brookes, P.C., et al. (2010). "Soil bacterial and fungal communities across a pH gradient in an arable soil." ISME Journal, 4, 1340-1351.
Documented pH effects on F:B ratios
Showed fungal decline at pH >6.5
Bacterial dominance at neutral to alkaline pH
Soil Structure and Physics
Sumner, M.E. (1993). "Sodic soils - New perspectives." Australian Journal of Soil Research, 31(6), 683-750.
Magnesium and sodium effects on clay dispersion
Threshold levels for structural damage
SAR (sodium adsorption ratio) theory
Heavy Metals and Contamination
Alloway, B.J. (2013). Heavy Metals in Soils: Trace Metals and Metalloids in Soils and their Bioavailability (3rd ed.). Springer.
Comprehensive review of heavy metal chemistry in soils
Effects on plants and soil organisms
Risk assessment frameworks
Giller, K.E., Witter, E., & McGrath, S.P. (1998). "Toxicity of heavy metals to microorganisms and microbial processes in agricultural soils: a review." Soil Biology and Biochemistry, 30(10-11), 1389-1414.
Heavy metal toxicity to soil microbes
Effects at parts-per-billion concentrations
Impacts on N-cycling, decomposition, enzyme activity
California Regulatory Frameworks
California Department of Food and Agriculture. (2023). "Soil Microbiology Assessment Framework: Defining Functional Soil Biology for Climate-Smart Agriculture."
Defines microbial diversity metrics
Fungal:bacterial ratio targets
Microbial biomass thresholds
Assessment protocols for biological verification
California State Legislature. (2016). "Senate Bill 32: California Global Warming Solutions Act of 2006: emissions limit."
40% GHG reduction mandate by 2030
Connection to agricultural practices
Verification requirements
Federal Programs
USDA Natural Resources Conservation Service. (2022). "Conservation Evaluation and Monitoring Activities (CEMA-216): Soil Testing Guidelines."
Baseline testing requirements
Outcome monitoring protocols
Approved testing methods
Data quality standards
USDA. (2025). "Regenerative Agriculture Pilot Program: Funding Announcement and Program Requirements."
$700 million FY2026 funding
Comprehensive soil testing requirements
Third-party verification standards
Outcome-based compliance framework
Appendix: Additional Resources
Soil Testing Laboratories
For complete chemistry panels:
Logan Labs (Ohio) - specializes in Albrecht Method
Brookside Laboratories (Ohio) - comprehensive testing
A&L Western Laboratories (California) - regional expertise
Waters Agricultural Laboratories (Georgia) - Southeast focus
For biological testing:
Soil Foodweb Inc. (Oregon) - microscopy-based analysis
Ward Laboratories (Nebraska) - biological metrics
Haney Soil Health Test - USDA-developed protocol
For heavy metals and contaminants:
Any certified environmental laboratory
Request parts-per-billion sensitivity
Specify metals: Pb, Cd, As, Hg minimum
Professional Organizations
For finding qualified consultants:
Advancing Eco Agriculture (AEA) - FieldLark
Soil Science Society of America
American Society of Agronomy
Ecological Farming Association (California)
ORCA Contact
Organic Regenerative Certified Apprenticeship
Dual state-federal registered apprenticeship program
Curriculum addresses soil chemistry, biology, and regulatory compliance
Developing safety protocols for vulnerable populations
calorcaprogram@gmail.com
Heavy Metals and Soil Microbiology: The Hidden Devastation
Critical Gap: Heavy metals don't just poison plants and humans - they devastate the soil microbiome first, creating a biological desert that can persist for decades.
Why Microbiology Matters
Soil is a living system. The Albrecht Method's "Three-Legged Stool" includes:
Balanced minerals (what we've been discussing)
Active soil biology (what heavy metals destroy)
Adequate organic matter (which biology creates)
Remove the biology leg → entire system collapses.
How Heavy Metals Kill Soil Microbes
1. Enzyme Inhibition - Death at the Molecular Level
All bacteria, fungi, and archaea rely on metalloenzymes:
Cadmium (Cd) Toxicity to Microbes:
Cd²⁺ displaces Zn²⁺ in zinc metalloenzymes
RNA polymerase (Zn-dependent) fails → no gene transcription
Carbonic anhydrase fails → pH regulation destroyed
Alkaline phosphatase fails → no phosphate cycling
Bacterial death threshold: 1-10 ppm Cd in soil
Mercury (Hg) Toxicity to Microbes:
Hg²⁺ binds all thiol groups (-SH)
Irreversibly inactivates ALL sulfur-containing enzymes
Even 0.1 ppm Hg = 50% reduction in soil respiration
Persists for years - Hg doesn't degrade
Lead (Pb) Toxicity to Microbes:
Pb²⁺ disrupts Ca²⁺-dependent enzymes
Cellulase (breaks down cellulose) inhibited
Amylase (breaks down starch) inhibited
Decomposition stops - organic matter accumulates undigested
Copper (Cu) Toxicity (when excessive):
Bordeaux mixture (Cu fungicide) has been used for 150 years
Works by killing fungi
Soil applications >50 ppm Cu suppress beneficial fungi
Kills mycorrhizae at >25 ppm
2. Cell Membrane Disruption
Heavy metals damage lipid membranes:
Mechanism:
Cd²⁺ + phospholipid membrane → lipid peroxidation → membrane leakage → cell death
Effects:
Bacterial cell walls rupture
Fungal hyphae lyse (burst)
Microbial biomass crashes within days of contamination
Research finding: Soil treated with sewage sludge (high Cd, Pb, Zn):
60% reduction in total bacterial count
80% reduction in fungal biomass
Effect persists >10 years after single application
3. DNA Damage in Soil Microbes
Heavy metals cause mutations in soil bacteria:
Cadmium mutagenicity:
Creates DNA strand breaks
Increases mutation rate 100-fold
Surviving bacteria are genetically altered
Functional diversity collapses - specialists die, only generalists survive
Arsenic mutagenicity:
Incorporates into DNA (replaces phosphate)
Creates unstable DNA → cell division fails
Population bottleneck - only As-resistant strains survive
4. Selective Pressure - Wrong Bacteria Win
Heavy metals don't kill everything equally:
Who survives:
Gram-positive bacteria (thick cell walls)
Spore-formers (Bacillus, Clostridium)
Pathogens (often more metal-resistant than beneficial microbes)
Who dies:
Gram-negative bacteria (most nutrient cyclers)
Nitrogen-fixers (Rhizobium, Azotobacter)
Mycorrhizal fungi (most sensitive to heavy metals)
Result: Pathogen-dominated, functionally degraded microbiome
Specific Microbial Casualties
Nitrogen-Fixing Bacteria - Critical Loss
Rhizobium (legume symbionts):
Nitrogenase enzyme contains Fe-S and Mo cofactors
Cd²⁺ displaces Fe in Fe-S clusters → enzyme fails
Growth threshold: >0.5 ppm Cd in soil solution = no nodulation
Effect: Legumes cannot fix N, require fertilizer instead
Azotobacter (free-living N-fixers):
Even more sensitive than Rhizobium
Toxicity threshold: >0.1 ppm Cd
Found in healthy soils, absent in contaminated soils
Loss = 20-50 lbs N/acre/year not fixed
Mycorrhizal Fungi - Ecosystem Collapse
Arbuscular Mycorrhizae (AM fungi):
Form 80% of plant-soil nutrient transfers
Extremely sensitive to heavy metals
Cd toxicity: >1 ppm = 50% colonization reduction
Cu toxicity: >10 ppm = complete colonization failure
Zn toxicity: >50 ppm = mycorrhizal death
What's lost when mycorrhizae die:
90% of plant P uptake (via fungal hyphae)
25% of plant N uptake
50% of plant Zn, Cu, Fe uptake
Soil structure (fungal hyphae bind aggregates)
Disease suppression (mycorrhizae outcompete pathogens)
Recovery time after contamination: 5-15 years minimum, often never
Decomposer Fungi - Organic Matter Stalls
Saprophytic fungi (white-rot, brown-rot):
Break down lignin, cellulose, complex organics
Produce enzymes: lignin peroxidase, cellulase, laccase
All are metalloenzymes (Cu, Mn, Fe required)
Heavy metal effects:
Cd >5 ppm: lignin degradation stops
Pb >50 ppm: cellulose degradation reduced 70%
Organic matter accumulates but doesn't form humus
Creates "inert" organic matter - present but not functional
Location B problem if contaminated:
11.5% OM (high)
If heavy metals from untested compost
OM present but not actively cycling
Biological deadpool
Phosphate-Solubilizing Bacteria - P Locked Up
Key genera: Pseudomonas, Bacillus, Rhizobium
Function:
Secrete organic acids
Dissolve Ca-P, Fe-P, Al-P
Make insoluble P available to plants
Heavy metal sensitivity:
Cd >2 ppm: 50% reduction in P-solubilization
Pb >20 ppm: 80% reduction
Even with high soil P, plants starve because bacteria can't mobilize it
Location B context:
P: 393 ppm (excessive)
But if heavy metals present
P-solubilizers killed
High P still unavailable - compounding the P excess problem
Nitrifying Bacteria - N Cycle Breaks
Ammonia oxidizers (Nitrosomonas):
NH₄⁺ → NO₂⁻ (requires Cu enzyme)
Nitrite oxidizers (Nitrobacter):
NO₂⁻ → NO₃⁻ (requires Fe enzyme)
Heavy metal effects:
Cd >1 ppm: nitrification reduced 30%
Cu >50 ppm: ammonia oxidation stops
NH₄⁺ accumulates (toxic to plants at high levels)
NO₃⁻ deficiency even with adequate N
Symptom: Soil has N, plants show N deficiency
Fungal:Bacterial Ratio Collapse
Healthy agricultural soil:
F:B ratio (biomass): 0.5:1 to 2:1
Fungi dominate in high-OM systems
Bacteria dominate in disturbed systems
Heavy metal contamination:
Fungi die first (more sensitive)
Bacteria persist longer
F:B ratio drops to 0.1:1 or lower
Bacterial-dominated = degraded soil
Why this matters:
Fungi store nutrients in biomass (slow release)
Bacteria release nutrients rapidly (leaching losses)
Fungi create stable soil structure
Bacteria create dispersed, erodible structure
Functional collapse even if total biomass looks OK
Microbial Diversity Loss
Before contamination:
5,000-10,000 bacterial species per gram of soil
1,000-2,000 fungal species
Complex food webs, functional redundancy
After heavy metal contamination:
500-1,000 bacterial species (90% loss)
100-200 fungal species (90% loss)
Specialists extinct, only generalists remain
Functional redundancy lost
Research finding: Soil treated with sewage sludge:
20 years later: still 60% reduction in species richness
Community structure never recovers to pre-contamination state
The Compost Vector - Unintended Consequences
Municipal compost (SB 1383 mandate) heavy metal levels:
Cadmium: 0.5-5 ppm (enough to kill N-fixers)
Lead: 50-200 ppm (enough to suppress decomposers)
Copper: 100-500 ppm (fungicide levels)
Zinc: 200-1000 ppm (toxic to mycorrhizae)
Application rate: 2-4 inches depth (common garden recommendation)
Result in soil:
Cd: 0.1-1 ppm added (N-fixer death zone)
Cu: 10-50 ppm added (mycorrhizal death zone)
Single application = decades of biological suppression
The tragedy:
Intent: Build soil biology with compost
Reality: Kill soil biology with heavy metals in untested compost
Opposite of intended effect
Farm-to-School Implications
Children's gardens using municipal compost without testing:
Immediate effects:
Mycorrhizae don't establish
N-fixers absent
Decomposition slow
Plants grow poorly despite "fertile" compost
Why plants still grow (poorly):
High nutrient content in compost masks problems
Plants accessing compost nutrients directly
Not accessing soil nutrients (biology dead)
Long-term effects (5-10 years):
Compost nutrients depleted
Biological recovery hasn't occurred
Soil worse than before amendment
Requires synthetic fertilizers to maintain production
The vicious cycle:
Add more compost (more heavy metals)
Biology further suppressed
Dependency on external inputs increases
Regenerative agriculture impossible
Molecular Mechanisms of Microbial Metal Resistance
Some bacteria survive - how?
Efflux pumps:
Proteins that pump heavy metals out of cell
Cd²⁺, Zn²⁺, Cu²⁺, Pb²⁺ actively expelled
Energy-expensive (growth slowed)
Metallothioneins:
Small cysteine-rich proteins
Bind heavy metals intracellularly
Sequester metals in harmless form
But reduces available cysteine for other proteins
Metal-binding exopolysaccharides:
Bacteria secrete sticky polymers
Polymers bind metals outside cell
Creates biofilm barrier
But immobilizes bacteria - can't colonize roots effectively
The cost of resistance:
Resistant bacteria grow 50-80% slower
Don't perform original functions (N-fixing, P-solubilizing)
Survival ≠ functionality
Soil has bacteria but they're not doing anything useful
Epigenetic Effects on Microbiome
Emerging research: Heavy metal exposure causes heritable changes in surviving microbes
DNA methylation in bacteria:
Heavy metals alter methylation patterns
Changes gene expression
Offspring inherit altered epigenome
Functional changes persist even after metals removed
Example:
Bacteria exposed to Cd for 10 generations
Cd removed
Bacteria still show reduced N-cycling activity 20 generations later
Epigenetic "memory" of contamination
Recovery Protocols - Is Restoration Possible?
Chelation and removal:
EDTA, citric acid to mobilize metals
Phytoextraction with hyperaccumulators
10-20 years minimum for meaningful reduction
Bioaugmentation:
Adding beneficial microbes back
Only works if metals reduced below toxicity thresholds
Otherwise added microbes die immediately
Can't bioremediate with biology if metals kill the biology
Mycorrhizal inoculation:
Critical for recovery
But mycorrhizae most sensitive to metals
Must reduce metals FIRST, then inoculate
3-5 years for full colonization recovery
Realistic timeline:
Year 0-5: Metal removal/sequestration
Year 5-10: Bacterial recovery
Year 10-15: Fungal recovery
Year 15-20: Full functional diversity restored
IF done correctly
Alternative: Abandon contaminated soil, start fresh elsewhere
Testing Requirements for Microbial Protection
Heavy metal testing (ppb sensitivity):
Cd: <0.1 ppm (100 ppb) to protect N-fixers
Cu: <10 ppm to protect mycorrhizae
Pb: <20 ppm to protect decomposers
Hg: <0.1 ppm to protect all functions
Biological testing:
Soil respiration (CO₂ production) - functional test
Fungal:bacterial ratio (microscopy or PLFA)
Microbial biomass (chloroform fumigation)
Enzyme assays (dehydrogenase, phosphatase, urease)
Compost testing before application:
Full heavy metals panel (8 metals minimum)
Biological activity (Solvita test)
Do NOT apply without testing
Key Citations - Microbiology & Heavy Metals
Foundational Research:
Brookes, P.C., & McGrath, S.P. (1984). "Effects of metal toxicity on the size of the soil microbial biomass." Journal of Soil Science, 35(2), 341-346.
Demonstrated 60% reduction in microbial biomass with sewage sludge
Effect persists decades after application
Giller, K.E., Witter, E., & McGrath, S.P. (1998). "Toxicity of heavy metals to microorganisms and microbial processes in agricultural soils: a review." Soil Biology and Biochemistry, 30(10-11), 1389-1414.
Comprehensive review: Cd most toxic to N-fixation
Cu most toxic to mycorrhizae
Pb most toxic to decomposition
Khan, S., Hesham, A.E.L., Qiao, M., Rehman, S., & He, J.Z. (2010). "Effects of Cd and Pb on soil microbial community structure and activities." Environmental Science and Pollution Research, 17(2), 288-296.
Species diversity reduced 90% after contamination
Community structure altered permanently
Frostegård, Å., Tunlid, A., & Bååth, E. (2011). "Use and misuse of PLFA measurements in soils." Soil Biology and Biochemistry, 43(8), 1621-1625.
Methodology for F:B ratio measurement
Standards for functional soil biology
Vig, K., Megharaj, M., Sethunathan, N., & Naidu, R. (2003). "Bioavailability and toxicity of cadmium to microorganisms and their activities in soil." Advances in Environmental Research, 8(1), 121-135.
Cd toxicity thresholds for different microbial groups
Nitrification most sensitive (>1 ppm = inhibited)
Mycorrhizal Research:
Gildon, A., & Tinker, P.B. (1983). "Interactions of vesicular-arbuscular mycorrhizal infection and heavy metals in plants." New Phytologist, 95(2), 247-261.
Established mycorrhizal sensitivity to heavy metals
Cu >10 ppm = colonization failure
Christie, P., Li, X., & Chen, B. (2004). "Arbuscular mycorrhiza can depress translocation of zinc to shoots of host plants in soils moderately polluted with zinc." Plant and Soil, 261(1-2), 209-217.
Mycorrhizae help plants tolerate Zn
But only if mycorrhizae survive contamination
Recovery Research:
Bååth, E., Díaz-Raviña, M., Frostegård, Å., & Campbell, C.D. (1998). "Effect of metal-rich sludge amendments on the soil microbial community." Applied and Environmental Microbiology, 64(1), 238-245.
20-year study: microbial community never fully recovered
Functional diversity permanently reduced
Policy-Relevant:
European Union. (2006). "Commission Regulation (EC) No 1881/2006: Maximum levels for certain contaminants in foodstuffs."
Sets Cd limits: 0.05-0.2 ppm in vegetables
Pb limits: 0.1-0.3 ppm in vegetables
Based on human health, not soil biology protection (which requires 10× lower limits)
California Department of Food and Agriculture. (2023). "Soil Microbiology Assessment Framework: Defining Functional Soil Biology for Climate-Smart Agriculture."
F:B ratio standards for different systems
Links biological function to regulatory compliance
Albrecht Method: Scientific Foundation for Target Ratios
Source: "The Ideal Soil v2.0: A Handbook for the New Agriculture" by Michael Astera with Agricola (2015), based on research by Dr. William A. Albrecht, Chairman of the Department of Soils at the University of Missouri (1938-1959), President of the Soil Science Society of America (1939).
The Albrecht Research (1920s-1960s)
Dr. William A. Albrecht and his associates at the University of Missouri Agricultural Experiment Station conducted extensive research on soil cation balance from the 1920s through the early 1960s. Their conclusion: The strongest, healthiest, and most nutritious crops were grown in soil with specific base saturation percentages.
Albrecht's Ideal Base Saturation:
Calcium (Ca): 60-85% (Optimum: 68%)
Magnesium (Mg): 10-20% (Optimum: 12%)
Potassium (K): 2-5% (Optimum: 4%)
Sodium (Na): 1-5% (Optimum: 1.5%)
Hydrogen (H): 5-10% (Optimum: 10%)
Key Principle: Ca + Mg together should add to 80% of exchange capacity in most agricultural soils pH 7 and lower.
"The world is changed by those who show up for the job." - Dedication to Dr. William A. Albrecht, The Ideal Soil v2.0
Why These Ratios Matter
Ca:Mg Ratio Determines Soil Structure
"It's still a little-known fact that the Calcium to Magnesium ratio determines how tight or loose a soil is." (Astera, 2015, p.20)
High Calcium Soil:
Looser structure, more oxygen, drains freely
Supports aerobic breakdown of organic matter
Better suited for heavy clay soils (target: 70-80% Ca, 10% Mg)
High Magnesium Soil:
Tighter structure, less oxygen, drains slowly
Organic matter breaks down poorly or not at all
May ferment and produce alcohol and formaldehyde (preservatives)
"If you till up last year's corn stalks and they are still shiny and green, you may have a soil with an inverted Calcium/Magnesium ratio." (Astera, 2015, p.20)
Location B Context: 78.8% Ca and 16.8% Mg - BOTH excessive - creates confused soil structure.
pH Self-Correction Through Mineral Balance
"The pH of the soil will automatically stabilize at around 6.4, which is the 'perfect soil pH' not only for organic/biological agriculture, but is also the ideal pH of sap in a healthy plant, and the pH of saliva and urine in a healthy human." (Astera, 2015, p.21)
Principle: "Balance the minerals and pH will take care of itself."
Secondary Elements: The "Twins/Opposites" Relationship
From The Ideal Soil Chart:
"Iron and Manganese are twins/opposites and synergists, as are Copper and Zinc." (Astera, 2015)
Target Ratios:
Iron (Fe): 1/3 to 1/2 × Ideal K (Minimum: 50 ppm)
Manganese (Mn): 1/3 to 1/2 × Fe (Minimum: 25 ppm, Maximum: 50 ppm)
Zinc (Zn): 1/10 × P (Minimum: 10 ppm, Maximum: 50 ppm)
Copper (Cu): 1/2 × Zn (Minimum: 5 ppm, Maximum: 25 ppm)
Ideal Ratios:
Fe:Mn = 2:1 to 3:1
Zn:Cu = 2:1
Location B Violations:
Fe:Mn = 10.6:1 (should be 2-3:1) - Mn severely dominated
Zn:Cu = 8.58:1 (should be 2:1) - Cu catastrophically blocked
Why Fe:Mn Balance Is Critical
Health Warning: "High levels of Manganese have been linked to BSE (Mad Cow Disease) and other degenerative neurological ailments, especially in soils that are deficient in Copper and Zinc." (Astera, 2015, p.59)
Guideline: "Unless the soil CEC is above 15 meq and the test shows it contains above 150 ppm Fe, we do not need or want to go above 50 ppm Manganese, and ideally, we do not want Mn to be more than ½ of Iron." (Astera, 2015, p.59)
Manganese's Essential Role: "There is an atom of Manganese at the center of the germ of every seed." Fruits like peaches and plums show shriveled seeds when Mn is deficient.
The Balance Requirement: Mn is essential, but excess Mn in the absence of adequate Fe, Zn, and Cu creates health hazards.
Calculation Formulas for ORCA Apprentices
Converting PPM to Pounds Per Acre:
Convention: Top 6-7 inches of an acre weighs 2,000,000 lbs
Formula:
1 ppm = 2 lbs/acre Amendment needed (lbs/acre) = (Target ppm - Current ppm) × 2
Base Saturation to PPM Conversion:
PPM = (% Saturation ÷ 100) × CEC × Conversion Factor Conversion Factors: Ca: 200 Mg: 120 K: 390 Na: 230
Example (Location B):
Current: 78.8% Ca saturation, CEC: 11.41 meq PPM Ca = (78.8 ÷ 100) × 11.41 × 200 = 1,798 ppm (Actual test: 1,836 ppm - calculation validated ✓)
Secondary Element Formulas:
Iron: Target Fe = (Target K ppm) × 0.5 (Minimum: 50 ppm)
Manganese: Target Mn = (Target Fe ppm) × 0.5 (Min: 25 ppm, Max: 50 ppm)
Zinc: Target Zn = (Target P ppm) × 0.1 (Min: 10 ppm, Max: 50 ppm)
Copper: Target Cu = (Target Zn ppm) × 0.5 (Min: 5 ppm, Max: 25 ppm)
Boron: Target B = (Target Ca ppm) × 0.001 (Min: 1 ppm, Max: 4 ppm)
Sulfur: Target S = (Target K ppm) × 0.5 (Min: 50 ppm, Max: 300 ppm)
Worldwide Validation
"Since the first e-book version was published in December of 2008, The Ideal Soil Handbook has gone around the world, and the Ideal Soil method has been applied in every imaginable climate and soil type. From Australia to Japan, South Africa to Finland, from Argentina to Alaska, and almost everywhere in between, readers have balanced the minerals of farms, ranches, greenhouses and backyard gardens. The method is in use on coffee plantations in the highlands of Laos and the hills of Zambia, rice farms in Thailand and the Philippines, horse pastures in Borneo and sheep pastures in Oregon." (Astera, 2015, Foreword, p.4)
Proven successful: Worldwide application since 2008, multiple language translations (Spanish, Dutch, Indonesian), foundation for additional published books.
The Sulfur Crisis: Why "No Antagonisms" Doesn't Mean "Not Critical"
Location A Sulfur Status: 8 ppm (Target: 100 ppm) - 92% DEFICIENT
Location B Sulfur Status: 100 ppm (Target: 100 ppm) - ADEQUATE
Why Sulfur Is Different
Sulfur has few antagonisms because it exists primarily as the sulfate anion (SO₄²⁻), not as a cation competing for exchange sites. But this doesn't mean it's optional - it means when it's deficient, EVERYTHING ELSE FAILS.
What Sulfur Does (The Foundation Element)
1. Protein Synthesis - The Master Function
Every protein contains sulfur. Period.
Sulfur-containing amino acids:
Cysteine (contains -SH thiol group)
Methionine (essential amino acid, cannot be synthesized)
If sulfur is deficient:
Proteins cannot be synthesized
Enzymes cannot be formed (all enzymes are proteins)
ALL biochemical processes stop
From The Ideal Soil: "Need for Sulfur amino acids. Conserves soil N and Carbon." (Astera, 2015)
The N-S Connection:
Ideal N:S ratio in plants: 10:1 to 15:1
Location A: Unknown N, but likely high (150 lbs/acre est. N release from OM)
With only 8 ppm S, the N:S ratio is catastrophically high
Excess N without S = cannot make proteins = N wasted as ammonia
2. Enzyme Active Sites - All Redox Reactions
Enzymes with sulfur cofactors:
Nitrate Reductase:
Requires molybdenum-sulfur (Mo-S) cofactor
Converts NO₃⁻ → NO₂⁻ → NH₄⁺
Without S: No nitrate reduction = no nitrogen assimilation
Sulfite Reductase:
Converts SO₄²⁻ → sulfide for cysteine synthesis
Contains iron-sulfur (Fe-S) clusters
Without S: Cannot make cysteine = cannot make any proteins
Glutathione Peroxidase:
Antioxidant enzyme
Contains selenium (Se) in active site, works with glutathione (contains sulfur)
Without S: No antioxidant protection = oxidative stress = cell death
Ferredoxins (all electron transport):
Contain Fe-S clusters
Essential for photosynthesis
Essential for nitrogen fixation
Without S: Photosynthesis stops, N-fixation stops
3. Humus Formation - The Organic Matter Problem
Quote from The Ideal Soil:
"If the mineral balance of the soil is optimal, especially with an adequate supply of Sulfur, any fresh organic matter grown in or added to the soil will tend to form stable humus. Without balanced minerals and adequate Sulfur, much of the organic matter will decompose completely and be off-gassed as ammonia and CO₂." (Astera, 2015, p.23)
This explains Location A:
Only 2.92% organic matter despite being grazed (animals add manure)
Sulfur: 8 ppm (severely deficient)
Organic matter cannot form stable humus without sulfur
OM decomposes to ammonia and CO₂ instead of building soil
This explains Location B (paradoxically):
11.5% organic matter (good)
Sulfur: 100 ppm (adequate)
Heavy organic amendments CAN form humus because S is adequate
But the humus is imbalanced because amendments were imbalanced
4. Sulfur and Soil Biology - The Microbiome Connection
Sulfur's role in microbial function:
Bacteria:
Sulfate-reducing bacteria (Desulfovibrio): Convert SO₄²⁻ → H₂S
Essential for sulfur cycling
Produce organic sulfur compounds
Low S = bacterial populations crash
Fungi:
All fungal proteins contain cysteine/methionine (sulfur amino acids)
Mycorrhizal fungi cannot colonize roots without adequate S
Low S = fungal:bacterial ratio collapses
Nitrogen-fixing bacteria (Rhizobia, Azotobacter):
Nitrogenase enzyme contains Fe-S clusters AND Mo-S cofactors
Without S: No nitrogen fixation possible
This is why legumes are especially sensitive to S deficiency
Location A Problem:
S: 8 ppm (92% deficient)
Estimated microbial biomass: <10% of optimal
F:B ratio: Likely bacteria-dominated (fungi require more S)
The entire microbiome is sulfur-starved
5. Heavy Metal Detoxification - The Protection System
Sulfur-based detoxification mechanisms:
Glutathione (GSH):
Tripeptide: glutamate-cysteine-glycine
Contains sulfur in cysteine (-SH group)
Primary cellular antioxidant
Binds heavy metals for excretion
Heavy metal binding:
Cd²⁺ + 2 GSH → Cd-GS₂ complex (excreted) Hg²⁺ + GSH → Hg-GS complex (excreted) Pb²⁺ + GSH → Pb-GS complex (excreted)
If sulfur deficient:
Cannot synthesize glutathione
Cannot detoxify heavy metals
Heavy metals accumulate in tissues
Phytochelatins (PC):
Sulfur-rich peptides: (γ-Glu-Cys)ₙ-Gly
Synthesized from glutathione
Bind Cd, Pb, Hg, As for vacuolar sequestration
Primary plant defense against heavy metal toxicity
Without sulfur:
No phytochelatin synthesis
Heavy metals freely damage proteins, DNA
Plant cannot protect itself
Location A Catastrophe:
S: 8 ppm (cannot make GSH or phytochelatins)
If contaminated with heavy metals from supplements fed to grazing animals
ZERO detoxification capacity
Heavy metals go straight into edible tissues
6. Sulfur and pH Management
Elemental sulfur (S⁰) oxidation:
2 S⁰ + 3 O₂ + 2 H₂O → 2 H₂SO₄ (sulfuric acid) (Oxidized by Thiobacillus bacteria)
This is how to lower pH:
Add elemental sulfur
Bacteria oxidize to sulfuric acid
Acid dissolves carbonates, releases locked nutrients
Location A at pH 5.3 doesn't need this
Location B at pH 7.0 DOES need this (but already has adequate sulfate-S)
7. The S-N-P Triangle
Sulfur coordinates with nitrogen and phosphorus:
N-S Relationship:
Protein synthesis requires both N and S
Ideal ratio N:S = 10:1 to 15:1
Excess N without S = ammonia volatilization, wasted nitrogen
P-S Relationship:
ATP (energy currency) = adenosine TRI-PHOSPHATE
But ATP synthesis requires sulfur-containing enzymes
Excess P without S = cannot use the P for energy
Location A:
N: ~150 lbs/acre (from OM)
S: 8 ppm = 16 lbs/acre
N:S ratio = 9.4:1 (barely adequate IF all S available)
But at pH 5.3, much S is locked up
Effective N:S ratio probably >20:1 = severe S deficiency
8. Sulfur and Microbial Suppression of Disease
Sulfur-oxidizing bacteria produce:
Organic acids (lower pH locally)
Biocides (suppress pathogens)
Chelating compounds (mobilize nutrients)
Sulfur deficiency = disease susceptibility:
Powdery mildew (worse with low S)
Root rots (anaerobic bacteria dominate when S-oxidizers absent)
Nematodes (suppressed by S-containing compounds from bacteria)
This is why traditional agriculture used "flowers of sulfur" as fungicide.
9. Sulfur Sources and Management
From The Ideal Soil:
Sulfur sources:
Gypsum (CaSO₄·2H₂O): 18% S, also supplies Ca
Elemental sulfur (S⁰): 90-95% S, acidifies soil
Ammonium sulfate [(NH₄)₂SO₄]: 24% S, also supplies N
Potassium sulfate (K₂SO₄): 18% S, also supplies K
Epsom salts (MgSO₄): 13% S, also supplies Mg
Target: "S = 1/2 × Ideal K up to 300 ppm" (Astera, 2015)
Location A needs:
Current: 8 ppm S
Target: 100 ppm minimum (K is 98 ppm, so 1/2 × 98 = 49 ppm, but minimum is 100)
Deficit: 92 ppm
Using gypsum (18% S):
92 ppm × 2 lbs/acre = 184 lbs S per acre needed
184 ÷ 0.18 = 1,022 lbs gypsum per acre
Plus this supplies 210 lbs Ca (addressing Ca deficiency simultaneously)
Location B status:
Current: 100 ppm S (adequate)
No S amendment needed
But this is one of the few things Location B got right
Why Location A's Low Sulfur Makes Everything Worse
Cascade of failures from 8 ppm sulfur:
Cannot synthesize proteins → all enzyme functions impaired
Cannot form humus → OM volatilizes as ammonia/CO₂ → low OM (2.92%)
Cannot support microbiome → biological collapse → no nutrient cycling
Cannot detoxify heavy metals → no GSH/phytochelatins → metals accumulate
Cannot fix nitrogen → nitrogenase requires Fe-S clusters → N-fixation fails
Cannot assimilate nitrogen → nitrate reductase requires Mo-S cofactor → N wasted
Cannot conduct photosynthesis efficiently → ferredoxins need Fe-S clusters → growth stunted
Cannot produce antioxidants → oxidative stress → cellular damage
Cannot suppress disease → no sulfur-oxidizing bacteria → pathogen pressure
All of this from 8 ppm sulfur instead of 100 ppm.
The Management Lesson
Sulfur doesn't have antagonisms because it's not competing for cation exchange sites.
But sulfur deficiency ENABLES all other antagonisms to be worse because:
Impaired protein synthesis = cannot make transport proteins (IRT1, ZIP, PHT1)
Impaired enzyme function = cannot convert nutrients to usable forms
Biological collapse = no microbial mobilization of nutrients
Heavy metal toxicity = no detoxification system
In Location A:
Ca deficiency? Worse because no Ca-binding proteins without S
K excess? Worse because no K-regulating enzymes without S
Heavy metals? CATASTROPHIC because no GSH/phytochelatins without S
Low OM? Directly caused by S deficiency preventing humus formation
Quote: "Without balanced minerals and adequate Sulfur, much of the organic matter will decompose completely and be off-gassed as ammonia and CO₂." (Astera, 2015, p.23)
This is Location A's story.
Sulfur in "Dust to Dust" Framework
Soil sulfur deficiency → Plant cannot make proteins → Food lacks sulfur amino acids → Human cannot make proteins/enzymes → Disease
Specific pathway:
Cysteine deficiency (from low soil S):
Cannot synthesize glutathione
Cannot detoxify heavy metals, pesticides, toxins
Oxidative stress increases
DNA damage accumulates
Cancer, neurodegeneration, autoimmune disease
Methionine deficiency (from low soil S):
Essential amino acid (cannot be synthesized by humans)
Required for protein synthesis initiation
Required for methylation reactions (epigenetics)
Without adequate methionine: DNA hypomethylation → gene dysregulation → disease
Children eating food from Location A soil:
Low cysteine → impaired detoxification
Low methionine → impaired growth and development
Both = compromised for life
Key Lessons for ORCA Apprentices
"The only way to know what we are starting with is to have the soil assayed by a soil testing laboratory. Once that test is in hand, the rest is pretty simple. Without the soil test results, we are floundering in the dark, we are merely guessing." (Astera, 2015, p.5)
Location B Error: Heavy amendments applied without baseline testing → severe imbalances.
2. More Is Not Better
"When calculating soil amendments, be conservative. If you think the amount you are putting on may be too much, use less. It's a lot easier to add more than it is to take something out after adding too much." (Astera, 2015, p.27)
Location B Violated This: Created excesses of Ca, Mg, P, Zn, Fe that cannot be easily removed.
3. Balance Matters More Than Amount
Location B has adequate amounts of most nutrients (high ppm values) but catastrophic imbalances (wrong percentages and ratios). This proves that balance > abundance.
4. The Three-Legged Stool
From Epilogue (Astera, 2015, p.111):
Balanced minerals (Albrecht Method ratios)
Active soil biology (microorganisms, fungi, earthworms)
Adequate organic matter (as humus, not just raw materials)
All three legs required for success. Remove one leg, the stool collapses.
Location B: Leg 1 BROKEN (minerals imbalanced), Leg 2 IMPAIRED (high Mg/low O₂/poor biology), Leg 3 DYSFUNCTIONAL (organic matter not forming proper humus due to mineral imbalance).
End of Technical Appendix
This appendix is intended as a comprehensive technical reference integrating molecular biology, soil chemistry, and the proven Albrecht Method. For the accessible main article, see: "When 'Good Soil' Isn't: Why Testing Matters More Than Ever"