From Hardpan to Harvest
How a rock-hard native soil was made productive in a single season — and tracked over four years to prove it holds. Nine certified-organic amendments at seven cents per square foot, Logan Labs verified."
David King
5/17/202636 min read
ORCA / SURPRISE VALLEY AGROECOLOGY · SVA-EDU-004 · v2.5
The Magnesium Lock
"How a rock-hard native soil was made productive in a single season — and tracked over four years to prove it holds. Nine certified-organic amendments at seven cents per square foot, Logan Labs verified."
Site: Test Garden R2 (Comptche, Mendocino County, CA)
Sampling depth: 0–6 inches | Lab: Logan Labs, LLC | Method: Mehlich III
Sampling dates: April 2022 (baseline) | April 2023 (one-year follow-up)
Audience: Farmers, market gardeners, ORCA apprentices, agronomic advisors
Executive Summary
This brief follows a single test plot through one growing season of corrective amendment. The Year 1 baseline showed a soil that on first glance looked salvageable — moderate organic matter, no obvious salinity, no glaring deficit. The chemistry told a different story. The exchange complex was magnesium-dominated, the pH was 5.3, exchangeable hydrogen sat at 36 percent of base saturation, and aluminum was solubilized at 786 ppm. This is not a red soil. This is a locked soil.
After one year of calcium-led, biology-first correction, the same plot moved into a substantially different functional category — pH 6.5, calcium more than doubled toward target, organic matter up by 56 percent, total exchange capacity expanded by 16 percent, and the full microbial loop reactivated as estimated nitrogen release rose from 78 to 95 pounds per acre. The mechanism of that transformation is the subject of this brief.
The central teaching point is this: the calcium-to-magnesium ratio is the single most consequential number on a soil report. It is upstream of nearly every problem a farmer associates with "bad ground" — compaction, crusting, poor drainage, weed pressure, fungal disease, slow nitrogen cycling, and stalled microbiology. Understanding why requires looking at the geometry of two ions, not the percentages on a page.
The one-sentence summary
Calcium pulls clay platelets together and lets a soil breathe. Magnesium holds them apart and shuts the soil down. The ratio between the two governs structure, biology, and the entire nutrient cycle.
1. The Two-Year Side-by-Side
Below are the parameters most relevant to the story. Values come directly from the Logan Labs. The first line of data was 2022; the second line was 2023. There was one amendment broadcast after the first test.
Parameter
Year 1 (2022)
Year 2 (2023)
Interpretation
pH
5.3
6.5
Moved from acid into the productive band; a +1.2 shift is large for one season.
Total Exchange Capacity (meq/100 g)
9.85
11.41
Colloidal capacity expanded as organic matter built. Holding more, not just better.
Organic Matter (%)
2.92
4.55
+56% in one season; biology came online.
Calcium (ppm)
747
1541
Doubled. About three-quarters of the 2000 ppm amendment target.
Magnesium (ppm)
192
224
Rose modestly; the meaningful change is its relative share of the exchange.
Ca:Mg ratio (meq)
2.33 : 1
4.14 : 1
Out of the magnesic danger zone but not yet at the structural target of 6.5–7 : 1.
Potassium (ppm)
98
128
Still 48 ppm below target. Cation antagonism from Mg is suppressing K uptake.
Phosphorus, Mehlich III (ppm)
7
73
Tenfold increase. P was added; the finding is that corrected chemistry retains it.
Sulfur (ppm)
8
16
Doubled; protein and amino-acid synthesis no longer S-limited.
Aluminum (ppm)
786
675
Toxicity threshold ~300 ppm solution-active. Falling with pH but still elevated.
Exchangeable Hydrogen (% base sat.)
36%
7.5%
From far above the 10–15% healthy band into the lower end of ideal.
Zinc (ppm)
1.17
5.11
Released as pH rose past the Zn-Al precipitation point.
Estimated N release (lb/acre)
78
95
+22%. Aerobic biology is mineralizing organic N.
Bulk density (g/cm³)
0.92
0.96
Slight tightening; likely sampling variation, but worth watching given residual Mg.
The shape of these changes is consistent. Wherever calcium is the gating factor — pH, P retention in available form, Al detoxification, exchange-acid neutralization, Zn availability — the parameter moved in the right direction. Wherever magnesium remained the limiting factor — structural tightness, K uptake — the parameter moved less, or not at all.
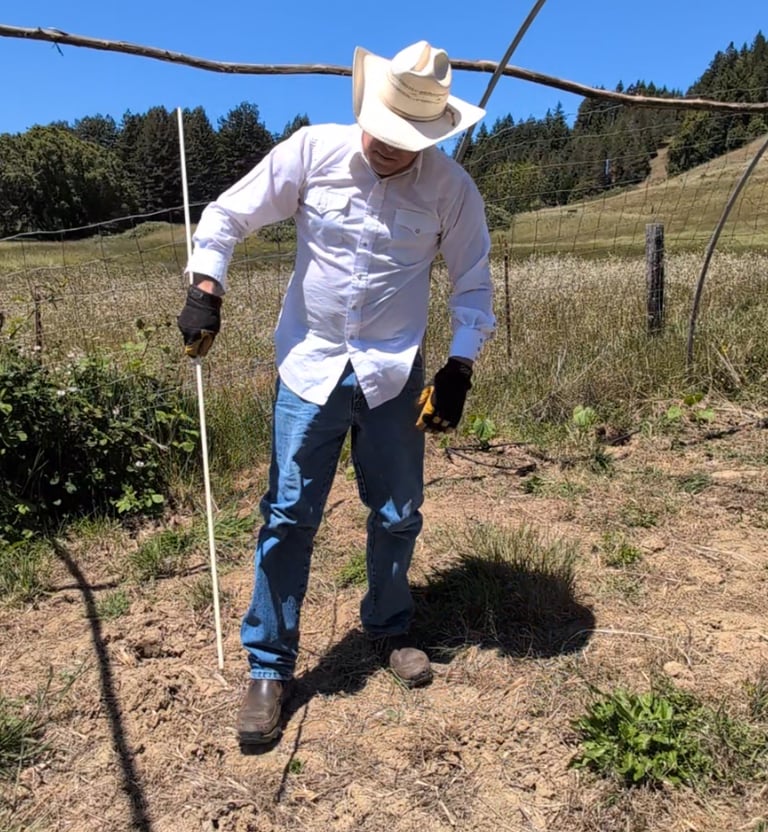
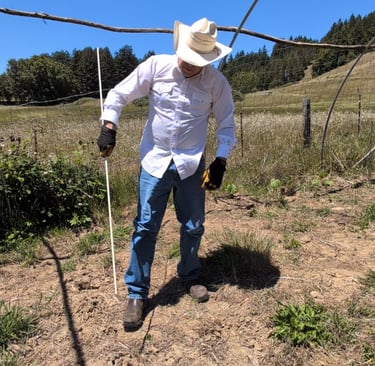
2. The Farmer's Shadow
The lab tests referenced throughout this brief — soil reports, microbial counts, plant tissue analysis — are not the primary diagnostic. They are tools that serve a more fundamental test: the eye and footfall of the farmer who casts a shadow on the same ground repeatedly, across seasons, over years. The Roman maxim that the best fertilizer is the farmer's footsteps captures something real. A single lab report shows one slice of one moment. The farmer's shadow shows pattern. Pattern is where diagnosis lives.
The sections that follow this one are quantitative — base saturation percentages, ppm readings, ratios on the milliequivalent scale. They will not mean the right thing if they are read without the observational frame this section establishes. The numbers serve the eye, not the other way around.
2.1 What to look for
Six observable signals diagnose any piece of working ground before any sample reaches a lab.
Compaction
By spade test (does the blade penetrate cleanly or stop at a layer?), by stride (do your boots sink in spring or rest on the surface?), and by water behavior (where does rain pool, where does it infiltrate). The unaided spade and the body weight of the person holding it are the most accessible compaction test on any farm.
Color
Surface and at depth. Dark indicates biological residue and stable carbon distributed through the profile. Pale indicates leached or biologically inactive ground. A clean color break between dark surface and pale subsoil is a diagnostic for a compaction floor that has cut off the lower zones from biological activity above.
Texture and structure
Aggregate size at the scale of the hand — microaggregate (sand-grain to crumb) versus macroaggregate (the visible crumb structure of a flocculated soil). The ribbon test for clay content. The soil-jar test for sand-silt-clay ratio by gravity settling. These three tests can be done with no equipment beyond a shovel, a jar, and water.
Lipid content
The slippery or gritty feel of moist soil between fingers; the surface gloss visible just after rain. Lipids are the signature of a soil that has accumulated stable microbial residue over time. A soil with no lipid character feels mineral and clean; a soil with developed lipid character feels almost soapy when fresh and rubbed between fingertips.
Nutrient cyclers
Springtails, mites, and worms — what shows up in a shovelful, what does not, and at what scale. Springtails jumping in surface litter, mites visible on aggregates, earthworms in the upper six inches: these are the macroscopic animals a farmer can read directly with the unaided eye. Their abundance, diversity, and distribution through the profile are visible bioindicators of the microbial community underneath them. The microscopic cyclers — nematodes, protozoa, the bacterial and fungal communities themselves — sit beneath this layer and require microscopy or DNA work to read.
Plant species
The weeds that volunteer and the crops that thrive or fail are the most accessible chemistry-and-biology reading on any farm. Sheep's sorrel and common dock indicate acid soil. Thistle indicates compaction. Mustards indicate available phosphorus and disturbed ground. Clovers indicate adequate calcium and low nitrogen. Goldenrod and bracken indicate poor drainage. Bioindicator species read the chemistry before the lab does — and they do not require a sample tube or a turnaround time.
2.2 What I see on this soil
On the native ground at the test site, the observational signature is consistent and tells most of the story before any sample is sent to a lab.
The surface shows visible cracks. In winter the soil behaves like thick clay — it pucks to boots, it holds moisture and refuses to drain, and when it dries between rains it seals the surface into a hard crust. The crust sheds the next rain rather than absorbing it, so water ponds in low spots and runs off the high ones. Most observers will call this a clay soil based on that winter feel.
The ribbon test reveals otherwise. The soil briefly forms a ribbon and then crumbles, which indicates a sand-dominant texture rather than a clay-dominant one. The soil-jar test confirms this: the clay stays in suspension for a long time, settles eventually as a translucent gel layered over a thin sliver of clay particles, with the bulk of the column made up of sand and silt at the bottom. Whatever the soil acts like in winter, what it actually is by particle size is sandy.
The regional pattern is consistent. Closer to the coast the sand particles are larger; moving inland the sand progressively becomes finer. But the calcium-to-magnesium ratio stays consistently low — magnesium-dominant — across the whole region. Whatever the parent material at each specific Mendocino-coastal site, the cation profile is the same magnesic syndrome.
2.3 The seasonal cycle of this climate
Every observation above is conditioned by where in the annual cycle the soil is sampled. Mendocino coastal benchlands run a predictable yearly pattern that frames every number in the rest of this brief.
• Hot summer months. The soil locks up. Temperatures rise, available moisture drops, biology goes dormant or migrates downward, and surface compaction returns at full strength. Most of the year's nitrogen sits unused because there is no water to mobilize it.
• First fall rains. The soil becomes active as moisture returns and the temperature drops out of the heat-stress range. Biology stirs. Compaction loosens. This is the start of the regional biological year.
• Continued winter rains. Cold and saturated. Useful biological work happens but rates are limited by low soil temperatures. Heavy rains flush mobile elements.
• Spring. A burst of microbial growth as soil temperatures climb back into the active range while moisture is still adequate. This is the productive window — short, intense, and the only time of year when chemistry and biology are both fully online together.
• By April. The ground hardens back to over 300 psi at the surface. The cycle restarts.
The April 2022 baseline sample and the April 2023 follow-up sample were taken at the same point in this annual rhythm — early in the dry-down, just after the spring biological burst. They are directly comparable to each other. A soil report read without seasonal context misleads the practitioner who has not yet walked the land.
The Observational Rule
Walk the land first. Read the cracks, the color, the worms, the weeds, the way water moves. Then sample. The lab report tells you what you already half-knew from looking, calibrated to numbers you can act on.
3. Year One: Diagnosing a Locked Soil
Read this report the way a clinician reads bloodwork. No single number is a diagnosis. The pattern is.
3.1 The headline numbers
pH 5.3 · Ca:Mg 2.33 : 1 meq · Aluminum 786 ppm · Exch H 36 %
Four numbers, one syndrome. This is the classic acid-magnesic profile of glacial- or marine-sediment-derived soils that have been worked without lime or calcium for several decades. Mendocino County coastal benchlands are typical.
3.2 What the farmer would have seen
If you were standing on this plot in spring 2022, you would have seen:
• A surface that crusts after the first rain after tillage, then cracks into hard plates as it dries.
• Standing water in low spots after a 1-inch rain that should have infiltrated.
• A dense, sticky feel when wet; a brick-like feel when dry.
• Sparse earthworm casts. Earthworms cannot move through soil this tight.
• Cover crops germinating unevenly and rooting shallowly, with the kind of "yellow-bottom" look that indicates a stalled nitrogen cycle.
• Brassicas and legumes underperforming relative to grasses, which is the visible signal of poor calcium nutrition.
• Slugs, snails, and root-feeding fungal pathogens (Pythium, Rhizoctonia) doing better than the crops.
3.3 Why each headline number matters
pH 5.3
At this pH, aluminum and manganese become soluble and phytotoxic, phosphorus precipitates with aluminum and iron into forms plants cannot reach, and most beneficial bacterial communities — including the entire nitrifying guild that converts ammonium first to nitrite and then to nitrate — are physiologically suppressed. Ammonifying bacteria, which break organic nitrogen down into ammonium, are more acid-tolerant and continue to function; the result is that ammonium keeps accumulating while nitrification stalls, and the soil cannot finish the nitrogen cycle. Fungal pathogens, by contrast, are tolerant of low pH and fill the niche the bacteria cannot occupy.
Aluminum 786 ppm
Aluminum is the third most abundant element in the Earth's crust. It is harmless when locked into clay lattices. It becomes toxic when pH drops below about 5.5 and the Al³⁺ ion is liberated into the soil solution, where it burns root tips, blocks calcium and magnesium uptake at the membrane, and ties up phosphorus into insoluble aluminum phosphate. At 786 ppm with a pH of 5.3, a meaningful fraction of this aluminum was solution-active. Roots in this plot were chemically pruned every time they tried to extend.
Exchangeable hydrogen 36 percent
Exchangeable hydrogen is the fraction of the cation exchange capacity occupied by H⁺ rather than by mineral cations. A healthy productive soil keeps this at 10 to 15 percent. At 36 percent, more than a third of the soil's negative charge sites were held by acid ions rather than by calcium, magnesium, potassium, or sodium. That is the structural meaning of "acid soil" — not just a pH number, but a colloidal complex that is undersaturated with nutrients.
Ca:Mg 2.33 : 1 on a meq basis
This is the number this entire brief is about. The next section explains it in full.
4. The Calcium-Magnesium Mechanism
To understand why this ratio matters more than the absolute amount of either nutrient, you have to look at the geometry of the two ions in water.
4.1 The master variable: hydrated ionic radius
Calcium and magnesium are both divalent cations — they carry a +2 charge — and on paper this makes them interchangeable. In a soil, they are not interchangeable at all. The difference is in how each ion behaves when it meets water.
The bare Ca²⁺ ion is the larger of the two in the crystal lattice (1.00 angstroms). The bare Mg²⁺ ion is smaller (0.72 angstroms). This seems straightforward until you put both ions into water, which is what soil chemistry always does.
Because Mg²⁺ is smaller and the same +2 charge is packed into less volume, its charge density is higher. That high charge density grips water molecules tightly. Magnesium pulls six water molecules into a rigid inner-sphere shell and holds them with a hydration energy of −1921 kilojoules per mole. Calcium, with lower charge density, holds only one or two water molecules loosely, with a hydration energy of −1577 kilojoules per mole.
The downstream effect is what matters. In solution, the hydrated Mg²⁺ ion is physically larger than the hydrated Ca²⁺ ion — roughly 4.3 to 4.8 angstroms across versus 4.1 angstroms for calcium. The smaller ion in the lattice becomes the larger ion in the soil solution. Everything downstream follows from this single inversion.
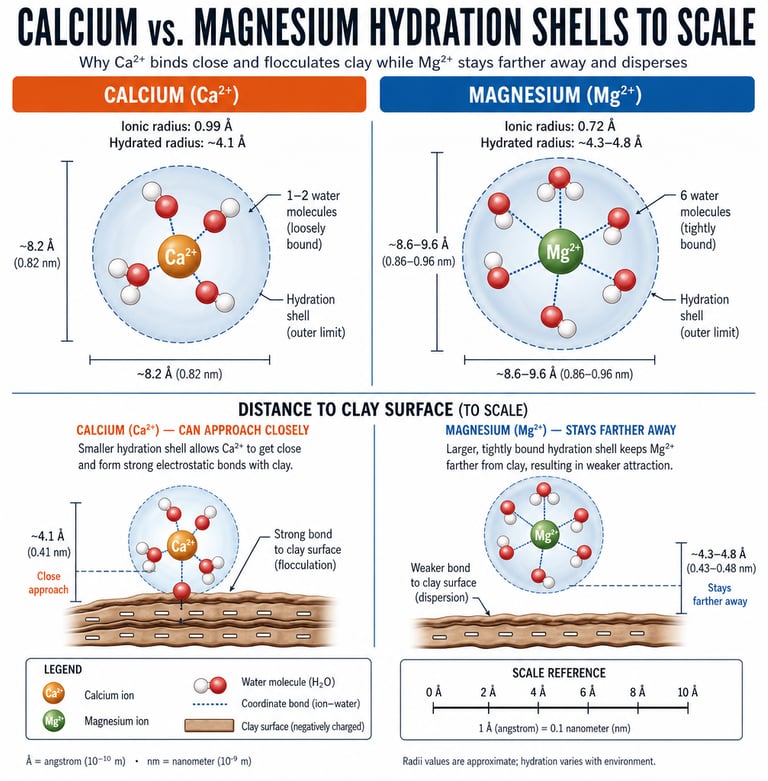
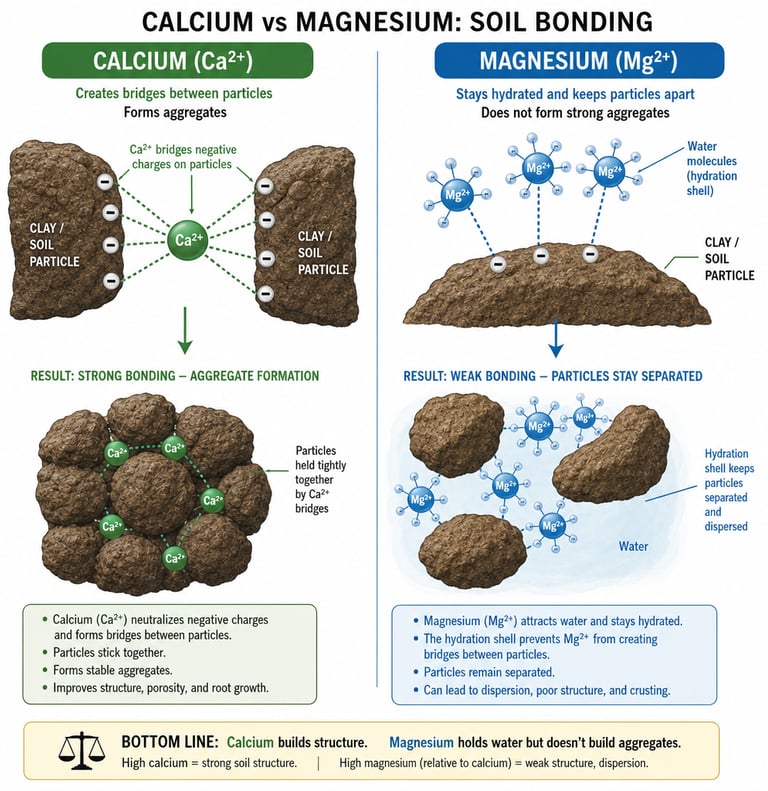
Figure 1A & 1B Calcium and magnesium hydration shells, drawn to relative scale. Calcium sheds its water and approaches the clay surface; magnesium keeps its water and stays farther away.
4.2 Flocculation versus dispersion
Clay platelets carry a permanent negative surface charge. Divalent cations like Ca²⁺ and Mg²⁺ are what bridge those platelets — adsorbing on one platelet and reaching across to a neighboring platelet, gluing them together into open, porous aggregates. This bridging is called flocculation, and it is the chemical foundation of soil structure.
Whether bridging happens depends on whether the bridging cation can get close enough to two platelets at once. Calcium, with its loose, easily shed hydration shell, sheds part of its water jacket on contact with the clay surface, approaches within about 4 angstroms, and forms strong electrostatic bonds with platelets on both sides. The platelets aggregate. Pores open. Air and water move. Roots travel. Earthworms travel. The soil breathes.
Magnesium does not do this. Its hydration shell is rigid. It cannot shed the water to approach the surface, so it sits 4.3 to 4.8 angstroms away, separated from the clay by a thick water film. Bonds form, but they are weak, and the larger water-padded ion physically holds neighboring platelets apart rather than pulling them together. The platelets slide. They migrate as colloidal suspensions. Structure collapses. This is dispersion.
The Structural Rule
Calcium flocculates. Magnesium disperses. Every drainage problem, every crust, every dense and gummy feel a farmer associates with "bad ground" is downstream of which of these two cations is winning the exchange.
4.3 The numerical targets
The base-saturation targets used in this brief — roughly 65–75 percent calcium and 10–15 percent magnesium on medium-to-heavy soils, working out to a Ca:Mg ratio near 6.5:1 — come from the cation balance research of William A. Albrecht at the University of Missouri, developed over roughly three decades of work in the mid-twentieth century. Sands run looser, around 3:1 to 5:1. Heavy smectic clays run tighter, closer to 7:1.
These numbers are working targets, not dogma. The behavior they produce is the point. Below about 4 : 1 the soil starts to disperse and seal. Below 3 : 1 the dispersion is severe and the soil functions as if it were magnesic, regardless of the absolute calcium number. Above about 10 : 1, magnesium availability to the plant starts to constrain chlorophyll synthesis. The wide band of 4 : 1 to 8 : 1 is where structure and biology both work.
Year 1 of this case study was 2.33 : 1. That is the magnesic zone.
5. The Magnesium Lock: How Mg Suppresses Biology
Structure is only the first layer. The chemical and biological consequences of magnesium dominance are larger and slower to recover. This is what we mean by the magnesium lock — a self-reinforcing pattern where structure, biology, and chemistry all reinforce each other in the wrong direction.
5.1 Macrobiology: the visible scale
Macrobiology is what a farmer sees with a shovel — roots, earthworms, beetles, springtails, the network of fungal hyphae visible against dark soil. All of it depends on pore space, oxygen, and infiltration.
Root systems
Root tips elongate by exploiting structural pores. In a flocculated calcium soil, roots travel down macropores already opened by previous roots, earthworm channels, and aggregate fissures. In a dispersed magnesium soil, those macropores are absent or collapse under saturation. Roots stop at the first compaction layer, fork sideways, and run shallow. The plant cannot reach the subsoil moisture or the subsoil minerals. The whole vertical dimension of the soil profile is amputated.
Earthworms
Earthworms require both moisture and oxygen — a soil that is wet but also air-filled in its macropores. Magnesium-dispersed soils saturate. The macropores fill with water; oxygen drops below the threshold worms need; populations collapse. Year 1 of this plot would have shown very few casts. Earthworm restoration is one of the most reliable indicators of recovery, and it lags the chemical recovery by a full season.
Soil arthropods and fungal networks
Springtails, mites, and beneficial nematodes occupy the same air-filled pore space. So does the aerobic fungal network — the mycorrhizal hyphae that extend the root surface area of the plant by an order of magnitude and trade phosphorus and water for plant sugars. All of this collapses in dispersed soil. What replaces it is anaerobic fungi — Pythium, Phytophthora, Rhizoctonia — that thrive in low-oxygen wet conditions and feed on stressed roots.
5.2 Microbiology: the unseen scale
Microbiology runs the nutrient cycle. Aerobic bacteria mineralize organic nitrogen into ammonium and then into nitrate. Aerobic bacteria oxidize sulfur into plant-available sulfate. Aerobic bacteria break down lignin and complex carbon. None of this happens at full speed without oxygen, and oxygen does not move freely through a dispersed soil.
The nitrogen cycle and the microbial loop
A functional bacterial-dominant soil runs two complementary nitrogen pathways at the same time. Nitrogen-fixing bacteria (Azotobacter, Rhizobium and other diazotrophs) capture atmospheric N₂ and pass it into the soil pool. Protozoa and bacterial-feeding nematodes then graze on those bacteria and excrete the excess nitrogen as ammonium — this grazing-excretion pathway is called the microbial loop, and it is one of the principal sources of plant-available ammonium in a healthy soil. Nitrifying bacteria (Nitrosomonas, Nitrobacter) then convert a portion of that ammonium to nitrate. The plant sees both forms cycling continuously and chooses according to its own preference.
The plant preference itself is not uniform. Early-successional crops — brassicas, lettuce, most leafy annuals, pasture grasses — perform best on the nitrate-dominant signal of a bacterial-dominant soil, which is why these crops do well on tilled, freshly compost-amended, biologically young ground. Later-successional and fruiting crops — tomatoes, peppers, perennials, fruit trees — perform best on the ammonium-dominant signal of a more fungally-influenced soil. A soil that is matched correctly to its crop produces healthy plants; a mismatch shows up as stress, susceptibility, and yield drag regardless of total nitrogen on the soil report.
When a soil drops into the magnesic-acid syndrome, the nitrate side of this cycle goes silent. Nitrifying bacteria are obligate aerobes with narrow pH tolerances — most active between pH 6.5 and 7.5, nearly inactive below pH 5.5 — and they are also the slowest-growing major group in the soil. They are the first to drop out under stress and the last to recover. Ammonium accumulates without conversion. The nitrate-dependent crops starve and bolt. The plants that survive are the acidophilic weeds — sheep's sorrel, common sorrel, dock, plantain. Weed pressure in magnesic soils is a consequence of microbial selection, not bad luck.
The phosphorus release problem
Mycorrhizal fungi and free-living phosphate-solubilizing bacteria release phosphorus from mineral and organic complexes. They need oxygen to do it. They also need their host plant to be photosynthesizing well enough to send carbon down the root. A magnesium-locked plant cannot fix carbon efficiently — because magnesium is the central atom in chlorophyll, this is one of the only places where Mg deficiency, rather than excess, would matter, but the more common case in our soils is that excess soil Mg is suppressing calcium-dependent membrane transport in the leaf, blocking carbon export to the root, and starving the rhizosphere community. Phosphorus release stalls. The plant rations P and runs underweight.
The cation antagonism wheel
Inside the plant root and in the soil solution, magnesium competes for the same uptake channels as potassium, calcium, ammonium, and to a lesser degree zinc, manganese, and iron. The competition is asymmetric. Mg binds the channel tightly and slowly. K and Ca bind quickly and turn over. When the soil solution is rich in Mg, the channels are occupied with Mg and the other cations cannot enter. This is the chemical reason that high-Mg soils typically show low plant tissue K, low Ca, and erratic micronutrient status even when the soil report shows those elements present. They are present but not accessible.
Cation antagonism when Mg is in excess:
• K uptake: blocked at the root channel; plant K deficiency despite adequate soil K.
• Ca uptake: competitively reduced; weak cell walls, blossom-end rot, tipburn.
• Nitrate uptake: stalled because nitrification itself has stalled.
• P availability: Mg-phosphate precipitates; further P fixation as Al-P at low pH.
• Zn / Mn / Fe uptake: secondary competition at the membrane; chlorosis between veins.
5.3 The trophobiosis link
Francis Chaboussou's trophobiosis framework explains why insect and disease pressure tracks nutritional imbalance. The mechanism is that stressed plants accumulate free amino acids and soluble sugars in their tissues rather than polymerizing them into proteins and complex carbohydrates. Free amino acids and soluble sugars are exactly what most leaf-eating insects and most fungal pathogens require to feed.
Cation imbalance — and especially excess Mg disrupting K and Ca — is one of the most reliable triggers of this accumulation. Magnesium-locked plants run high on free asparagine and free arginine, both of which are insect-attractive. The aphid outbreak, the slug pressure, the powdery mildew that just will not quit — these are not pest problems. They are nutritional signals. The soil chemistry is upstream of the field signs.
Chaboussou's original work has been extended substantially since the 1980s. Larry Phelan's nutritional mediation hypothesis at Ohio State provided empirical experimental support for crop-specific insect attraction tied to fertilization regimes — most cleanly in his European corn borer work. Olivier Husson's research on soil and plant redox potential has tied the nutritional balance directly to electron flow in plant tissue. The contemporary plant sap analysis movement — most visibly through John Kempf's Advancing Eco-Agriculture — has translated the framework into in-season diagnostics that growers can run on their own crops and act on within days. The throughline across all of this work is consistent: imbalanced soil chemistry produces imbalanced plant nutrition, which produces insect and disease susceptibility. The cation balance this brief is built around is one of the upstream chemistry conditions in that cascade.
6. The Intervention Sequence
The soil data and the field observations describe the before and the after. This brief would be incomplete without describing what was done between them. The intervention sequence on the garden test plot was modest, deliberate, and ordered — four steps over the first growing season, each one a prerequisite for the next.
6.1 First — compaction removal
The starting condition was the locked soil described in Section 3. No amendment, no biological input, and no plant root will integrate into a soil that cannot breathe. The first intervention was mechanical opening of the surface compaction layer, done without inverting the profile and without incorporating any amendments. The goal was to create initial vertical pathways for water, air, and root extension — not to till, not to mix, not to disturb the surviving biology any more than necessary. This step alone does not produce a recovery, but no recovery is possible without it.
6.2 Second — eight weeks of rest
This is the step most often skipped, and skipping it tends to collapse the entire sequence. After any mechanical disturbance, the biology that survived needs time to re-establish baseline activity before it can integrate new inputs. Eight weeks is roughly the cycle time required for the bacterial community to stabilize after disturbance. Pushing amendments into the soil during this window typically wastes them — the biology cannot process what arrives, and the chemistry shifts faster than the biology can adapt to it. The rest period costs nothing but time, and it determines whether the next two steps succeed or stall.
6.3 Third — modest, calcium-led elemental balancing
The chemistry correction was calcium-led, applied at a modest rate, and surface-applied without incorporation. The goal was not to drive the cation exchange to the structural target in a single application. The goal was to begin the shift, allow the biology to integrate the change, and let the next sample tell us where to go from there. Aggressive amendment rates produce visible short-term changes that often undo themselves over the following season. Modest rates trade speed for durability.
The elemental balancing step is a quantified operation, not a general direction. Before any amendment hits the ground, each nutrient is given a specific target concentration in parts per million, calculated against the soil's cation exchange capacity. The table below shows the Year 1 soil test value, the target the amendment program was calibrated to reach, and the Year 2 actual value. Empty target cells indicate that no amendment was applied — either because the starting value already exceeded the target, or, in the case of magnesium, because reducing that cation's relative dominance on the exchange was a goal of the program.
Element
Year 1 (ppm)
Target (ppm)
Year 2 (ppm)
Ca
747
2000
1541
Mg
192
—
224
K
98
200
128
S
8
300
16
P
7
300
73
B
0.2
1.3
0.37
Fe
165
—
120
Mn
52
82
62
Cu
1.39
15
2.97
Zn
1.17
24
5.11
Co
0.438
0.9
0.7
Mo
0.41
—
<0.02
N (release)
39
50
48
Only one target was actually reached — nitrogen release — and notably, that came from biology activating after the pH crossed back into the productive band, not from any direct nitrogen amendment. The N release row is in ppm equivalent (Logan Labs reports the same value as 78 lb/acre in Year 1 and 95 lb/acre in Year 2). Among the mineral amendments, the rest of the table shows partial retention at best.
The pattern of where the soil retained the amendment closer to target and where it did not is itself diagnostic. Calcium climbed from 747 to 1541 — a substantial recovery, but still about three-quarters of the 2000 ppm target. The lighter cation amendments (Co, Mn) reached roughly three-quarters of target by Year 2. Potassium reached two-thirds of target — and the shortfall here is the most direct field-evidence in this brief that residual magnesium chemistry is still antagonizing potassium uptake at the root membrane. The heavier cation amendments (Cu, Zn) reached only about one-fifth of target. Phosphorus, boron, and sulfur retained well below target — phosphorus partly because some aluminum-phosphate fixation was still happening at the residual aluminum level; boron and sulfate because both are highly mobile anions that move with water rather than binding to a calcium-flocculated exchange.
For order-of-magnitude context: the certified-organic mineral inputs for the full nine-amendment correction at the rates applied to this test plot came to approximately seven cents per square foot broadcasted — roughly $69 per 1,000 square feet, or about $3,000 per acre, at Grow West (Ukiah, California) May 2022 pricing. The materials themselves are not the expensive part of soil correction. Knowing what to apply, in what proportion, in what order, at what timing, for what specific soil is the part that has value — and it is the part that does not show up on a Grow West invoice.
6.4 Fourth — a single biologically complete compost extract
One liquid application of compost extract — drawn from a properly built compost containing bacteria, fungi, protozoa, and beneficial nematodes — was applied to the surface. No bulk compost. No biomass imports. No further inoculations during the year. The single extract was sufficient because the previous three steps had set up the conditions for the introduced biology to find a working environment: open pore space from the compaction removal, a stabilized baseline community from the rest period, and the beginnings of a calcium-flocculated structural envelope from the elemental balancing. The biology multiplied into a soil that could receive it.
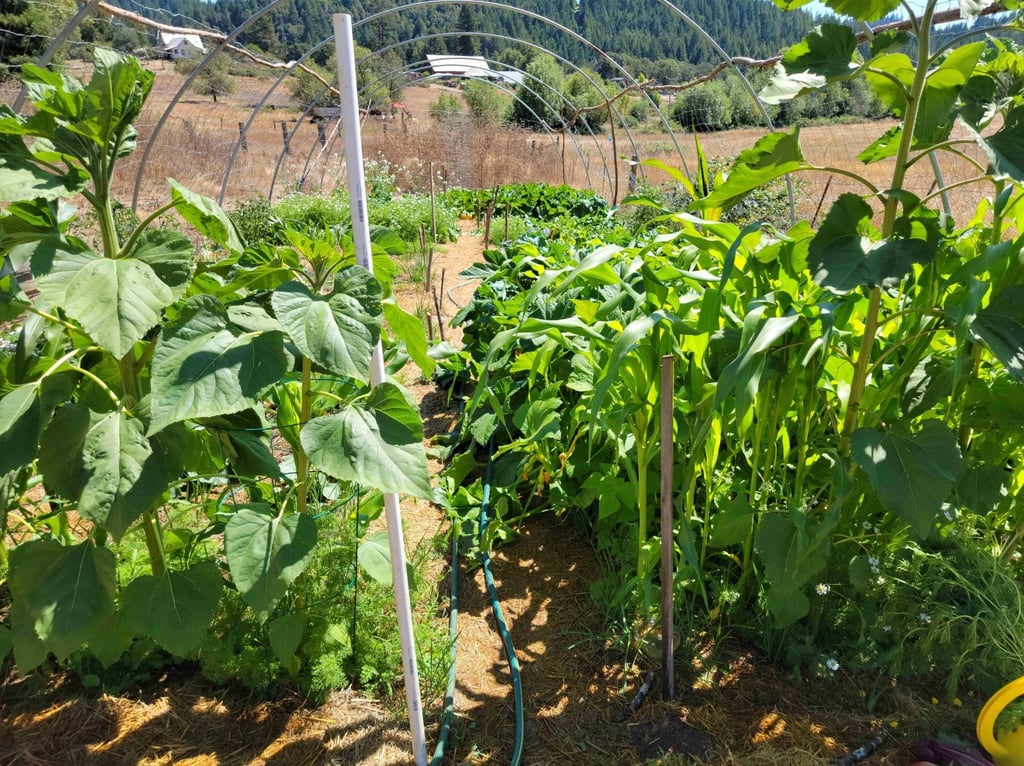
Figure 2. Garden test plot during the first growing season after the intervention sequence. Mature plantings — sunflowers in bloom, climbing crops, a dense closed canopy — established in the same parent soil that produces the magnesium-locked two-inch breathing zone shown in Figure 3.
6.5 Why the sequence matters more than the inputs
What this sequence demonstrates is that the inputs to a recovering soil are not the cause of its recovery. The cause is the sequence. Compaction removal without rest produces a brief recovery that collapses by midseason. Rest without chemistry produces winter biology that fails in summer. Chemistry without biology has nothing to build into. Biology without chemistry has nothing to feed. The order matters, the proportion matters, and modesty matters. The garden test plot received less of each input than most regenerative or biological farming protocols would prescribe — and it outperformed both the native grazing land and the cover-crop-only pile because the sequence was right.
The Intervention Rule
First open the soil. Then let it rest. Then correct the chemistry, modestly. Then introduce the biology, once. The inputs are not the cause of the recovery. The sequence is.
7. Year Two: What the Numbers Tell Us
After one year, the same plot reads as a fundamentally different soil. The mechanism of the change is calcium-led — every parameter that moved meaningfully moved because the exchange complex picked up calcium and shed acid hydrogen and soluble aluminum.
7.1 What worked
• pH climbed from 5.3 to 6.5. This single shift moved the soil through the threshold where nitrifying bacteria reactivate, aluminum precipitates, and phosphorus solubilizes.
• Calcium nearly doubled. From 747 to 1541 ppm. Base saturation calcium rose from 38 to 68 percent — a 30 percentage-point shift on the exchange complex in one season.
• Exchangeable hydrogen fell from 36 percent to 7.5 percent. The acid charge sites filled with calcium. This is the structural signal of recovery.
• Plant-available phosphorus rose from 7 to 73 ppm. P was added; the meaningful finding is that the corrected chemistry now retains the addition in available form.
• Organic matter rose 56 percent. From 2.92 percent to 4.55 percent. Aerobic biology came online and began building stable carbon.
• Total exchange capacity expanded by 16 percent. From 9.85 to 11.41 meq/100 g. The soil now physically holds more nutrient charge.
• Zinc and sulfur both released. Zn from 1.17 to 5.11 ppm, S from 8 to 16 ppm. Both are pH-dependent.
7.2 What did not work — yet
• Ca:Mg ratio is 4.14 : 1, not 6.5 : 1. The plot has come out of the magnesic zone but is not yet at the structural ideal.
• Potassium is still deficient. 128 ppm against the 200 ppm amendment target — a 72 ppm shortfall. Residual Mg is still antagonizing K uptake at the root membrane.
• Bulk density did not fall. It actually nudged from 0.92 to 0.96 g/cm³. Structure does not rebuild in a year; expect another two seasons before the aggregate work shows up here.
• Molybdenum dropped below detection. From 0.41 to under 0.02 ppm. Likely tie-up rather than loss, but worth a tissue test in year 3.
• Selenium fell sharply. From 0.82 to 0.25 ppm. Same mechanism as Mo — tie-up in active organic matter and iron oxide complexes.
• Sodium doubled. From 11 to 22 ppm. Still safe, but if irrigation water is the source this will accumulate. Worth a water test.
7.3 Reading the trajectory
The honest summary is that the chemistry has shifted decisively in the right direction, the biology has begun to follow, and the structural indicators are lagging — which is exactly the order in which a soil recovers. Chemistry moves in weeks. Biology moves in months. Structure moves in years.
Year 2 of this case study is at the end of the chemistry-driven phase. Year 3 should be a biology-driven year. Year 4 and 5 should be the structural years, when bulk density falls, aggregate stability rises, and the visual feel of the soil changes.
8. Field Validation: Three Plots, One Site
The lab data tells part of the story. The shovel tells the rest. On the same parcel where the garden test plot sits, two adjacent reference sites let us see what 165 years of continuous grazing produces, what cover cropping alone produces, and what calcium-led correction with minimal biological inoculation produces.
8.1 The three plots
Native grazing land — the historical baseline
This soil has been continuously grazed by cattle since the 1860s and by horses for the last twenty-five years. It carries roughly one inch of true topsoil over a compaction pan that begins almost at the surface. Roots that establish in the winter wet season are choked off as the soil dries. The dry color is pale, which is the visual signal of low organic matter and minimal microbial residue.
Under a 200-pound body weight on a standard spade, the blade penetrates only about one inch before stopping. Surface bearing resistance is well above 350 psi by field estimate. For comparison, a tractor tire imparts 15 to 30 psi; a horse hoof at a standstill is in the 30 to 50 psi range, but a hoof in motion — a trot, a sliding stop, a sharp turn — can spike to several hundred psi for a fraction of a second. After 165 years of intermittent impact at those pressures, with no calcium correction and no rest between cycles, the profile has consolidated into the form we see now.
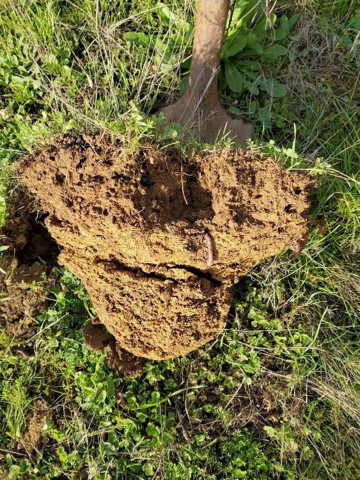
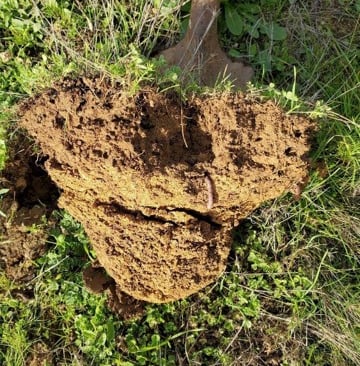
Figure 3. Native grazing land in cross-section. Two inches of darker biologically active topsoil over the pale, magnesium-suppressed subsoil. The worm visible at the boundary is pinned at the only zone where biology is still possible — above the compaction pan it cannot cross.
Cover-crop-only pile — biology without chemistry
This plot began as a pile of fine soil excavated during an unrelated onsite construction job. It was set aside, left untouched by hooves or machinery, and seeded only by what arrived on its own. It moved through the classic succession that disturbed soils run when given time — first thistle, then broadleaf forbs, then perennial grasses establishing as the surface stabilized. No amendments. No inoculations. No chemistry intervention. Just sun, rain, seed rain, and time.
By visible appearance, this is the most carbon-rich profile on the site. The soil reads as milk-chocolate brown to a depth of three feet. The winter worm count in the top six inches is the highest of any site tested — roughly thirty in a single shovelful. Under body weight, the spade penetrates about three inches before stopping. The cover crop biomass above ground is the densest on the parcel.
By May, the picture changes. The same soil hardens, the worms migrate downward or die back, and the spade test that yielded three inches in spring will not yield much more than an inch by the start of the dry season. The biology built through the winter cannot persist through the dry-down. Carbon was built. Structure was not.
Garden test plot R2 — chemistry-led with light biology
This is the plot the lab data in sections 1 through 5 describes. It received elemental balancing across the 2022–2023 season — the calcium-led correction that drove pH from 5.3 to 6.5 and saturated the exchange with calcium. It received exactly one liquid inoculation from a biologically complete compost, and no bulk compost was added.
Under body weight, the spade sinks the full depth of the blade — twelve inches or so — and pulls up cleanly. The soil color is dark to three feet, indicating microbial residue and stable carbon distributed through the profile. The winter worm count is twenty to twenty-five in the top six inches, somewhat lower than the cover crop pile. In summer, the worm population persists rather than collapsing. The soil remains workable. Vegetable production is real — not as biomass-heavy as the cover-crop-only plot, but durable across the season.
8.2 The spade-test summary
The numbers below are SVA field observations from spade tests and visual assessment, not lab data. They are reproducible by anyone working the same ground with the same body weight and a standard garden spade.
Parameter
Management history
Native Grazing (1860s) 165 yrs grazed; 25 yrs horses
Cover-Crop Pile Disturbed pile; succession only
Garden Test Plot Ca-led correction + 1 inoc.
Topsoil depth
Native Grazing (1860s) ~1 inch
Cover-Crop Pile Well-developed
Garden Test Plot Active to 3 ft
Spade penetration (200 lb)
Native Grazing (1860s) ~1 inch
Cover-Crop Pile ~3 inches
Garden Test Plot Full blade (~12 in)
Surface bearing resistance
Native Grazing (1860s) > 350 psi
Cover-Crop Pile Moderate
Garden Test Plot Low
Dry-soil color
Native Grazing (1860s) Pale
Cover-Crop Pile Milk-chocolate to 3 ft
Garden Test Plot Dark to 3 ft
Winter worms (top 6 in)
Native Grazing (1860s) Few
Cover-Crop Pile ~30
Garden Test Plot 20–25
Summer worms
Native Grazing (1860s) Few
Cover-Crop Pile Collapse
Garden Test Plot Persist
Cover-crop biomass
Native Grazing (1860s) Sparse
Cover-Crop Pile Densest
Garden Test Plot Moderate
Vegetable production
Native Grazing (1860s) n/a
Cover-Crop Pile Modest
Garden Test Plot Durable across season
Summer microbial function
Native Grazing (1860s) Absent
Cover-Crop Pile Collapses
Garden Test Plot Persists

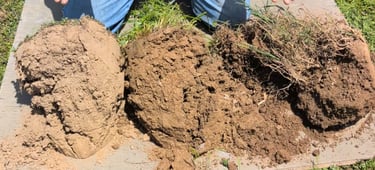
Figure 4. The three plots, side by side. Left: native grazing land. Middle: cover-crop-only pile. Right: garden test plot. Same parent material. Same season. Same site. The differences are management.
8.3 What the cover-crop plot teaches
The cover-crop-only pile is the most carbon-rich and most biomass-rich profile on the site. By every metric the regenerative literature emphasizes — visible darkness, depth of carbon, cover crop density, winter biological activity — it is the obvious success story. It is also, by May, the plot where the worms have gone, where the spade test will not advance, and where the biology cannot do its work. By the time the surrounding native grazing land has hardened back to summer compaction, the cover-crop-only pile is on the same trajectory — just from a higher starting point.
The reason is the magnesium lock. The pile was built from excavated subsoil that retained the parent-material cation chemistry of the site — magnesium-dominated, calcium-undersaturated. Carbon was added by plant succession on top. None of the carbon addition shifted the mineral chemistry of the colloidal complex. When the soil wets, the magnesium-dominated clay swells. When it dries, the clay shrinks and consolidates without the calcium bridges needed to hold open the pore space. The soil becomes physically impassable to the biology that lived in it three months earlier.
The teaching is not that cover cropping fails. The cover crop did exactly what cover crops do — it built carbon, hosted winter biology, and stabilized the surface against erosion. The teaching is that cover cropping cannot, by itself, build the structural envelope that biology requires through the dry season. Carbon is one of the inputs to soil structure. Calcium-bridged aggregation is the other. Without both, the envelope collapses every summer.
8.4 What the garden plot teaches
The garden plot received calcium-led elemental correction and exactly one biological inoculation. It built less cover crop biomass than the cover-crop-only plot. It carried a lower winter worm count. By the regenerative biomass metrics, it would not have been the obvious success.
By the structural and dry-season metrics, it is. The spade sinks all the way under body weight. The dark color and visible microbial action extend to three feet. The worms remain through the summer. The soil holds the structural envelope through the dry-down because the calcium-bridged aggregates remain intact as the soil contracts. Gas exchange continues. Water infiltration continues. The biology that established during the wet season finds the pore space it needs to keep working through August and September.
The minimal biological inoculation matters here. The plot did not need a heavy biology input — it needed a structural envelope where the biology already present could function. One inoculation of complete compost extract was sufficient because the chemistry had been set up to receive it. This is the leverage point. Biology multiplies into a structurally healthy soil. Biology stalls in a structurally locked one, regardless of how much you add.
8.5 What aggregation looks like in the hand
The photograph below is from the garden test plot mid-season during the recovery years. A handful of soil pulled up with a cover-crop root mass shows what calcium-flocculated, biologically active soil actually looks like at the scale you can hold.
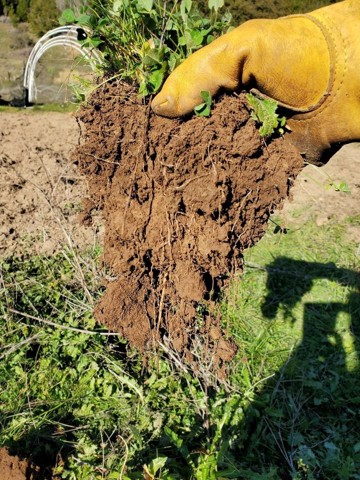
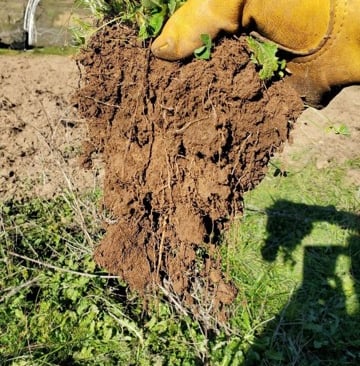
Figure 5. Garden test plot, mid-season. A cover-crop legume pulled up with its root mass. The chunky crumb structure, the vertical pore channels visible between aggregates, the way the soil clings to the fine root hairs without disintegrating into fines, and the uniform dark color throughout the clump are the visible signature of a calcium-bridged, fungally-bound soil.
What you are looking at is not random clumping. Aggregate formation in soil follows a strict sequence, and you can read the sequence directly off this photograph.
The bacterial stage — microaggregates
When the chemistry permits aerobic bacteria to function — meaning calcium is on the exchange and pH is in the productive band — bacterial populations expand and secrete polysaccharide exudates. These polysaccharides are sticky glues that bind mineral particles, fine clay, and silt into small aggregates roughly fifty to two hundred and fifty microns across. These are the microaggregates. They are the foundational unit of soil structure, and they are stable against water for short periods.
This is the first stage of recovery. In the garden plot, it took roughly the first three to four months after the calcium correction. The bacteria that build microaggregates are the same bacteria that mineralize organic nitrogen — which is why the lab report's estimated nitrogen release rose from 78 to 95 pounds per acre over the same window.
The fungal stage — macroaggregates
Once microaggregates are present, fungi begin to do their work. The hyphal network of mycorrhizal and saprophytic fungi physically threads through the microaggregates, enmeshing them into larger crumbs that are typically a quarter of a millimeter to several millimeters across. These are the macroaggregates — the crumb structure that is visible to the naked eye. Fungi also secrete glomalin, a glycoprotein that further cements the macroaggregate against water disruption and against the shrink-and-swell stress of seasonal wetting and drying.
A macroaggregated soil holds its structure under rainfall. It holds its pore space under contraction. It survives the dry-down with its architecture intact. This is the structural envelope that the entire teaching point of this brief turns on. Without macroaggregates, the soil collapses each summer; with them, biology persists year-round.
8.6 The same structure all the way down
Figure 5 shows the aggregate structure at the scale a farmer can hold. The next photograph shows the same structure persisting through the full soil profile — the test made by digging a post-hole into the garden plot and laying the excavated material out alongside the open hole.
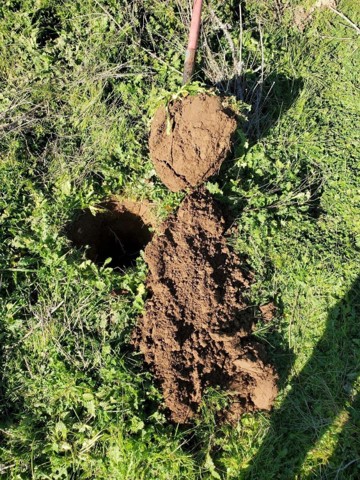
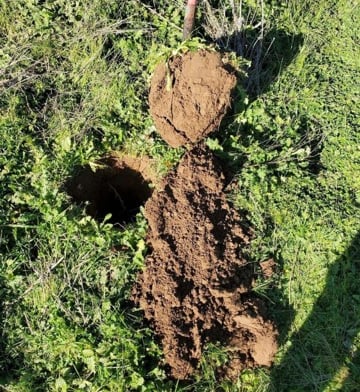
Figure 6. Garden test plot, post-hole dig. The intact surface clod at the top of the spread retained its cover crop and root mass; the loose material below it is the rest of the profile broken apart for inspection. The soil is uniformly milk-chocolate brown from surface to the bottom of the hole, with macroaggregate structure persisting through the full depth and no compaction band or color break.
Three structural facts read directly off this photograph. The first is uniform color — milk-chocolate brown from the surface clod down through the bottom of the excavated material. That color comes from the residues of microbial life distributed evenly through the profile. A magnesic or compacted soil does not produce this color signature; it produces a thin dark band at the surface over progressively paler subsoil. The uniform color here is the visible record of biology functioning at depth.
The second is uniform aggregate structure — the same crumb structure throughout. There is no transition zone where loose surface aggregates give way to a massive, structureless subsoil. The bacterial polysaccharides and fungal hyphae that build the surface aggregates have built them all the way down.
The third is the integrity of the hole itself. The post-hole stands open with intact walls. In a dispersed magnesic soil, a post-hole this depth would have sloughed at the sides on the way down. A clean-walled hole is a structural signal — the soil has the cohesion to stand at the angle of repose because the calcium-bridged aggregates hold their shape under their own weight.
Compare this mentally to what the same test would have produced on the native grazing land. There, a post-hole digger meets the compaction pan at roughly one inch and stops. The contrast is total. Three feet of biologically continuous soil versus one inch of breathing zone over a pan. This is what the chemistry buys.
8.7 The integrated teaching point
What this field comparison shows is that biology and chemistry are not alternative strategies. They are sequential prerequisites. The chemistry creates the structural envelope. The biology fills it. Without the chemistry, the envelope collapses each summer and the biology has to start over each fall. Without the biology, the structure has nothing to feed and the carbon does not accumulate. Either alone fails in a different way. Both together is the only durable configuration.
The regenerative literature has been correct that biology builds soil. It has been incomplete on the question of why some biologically managed soils never finish the job. The answer in the field — confirmed by this three-plot comparison — is that no amount of biology can build a calcium-flocculated aggregate when the calcium is not there to do the flocculating. Carbon-led management without mineral correction has a ceiling, and the ceiling is whatever the underlying cation chemistry allows the structure to do.
The Field Rule
If you want functional microbiology in the soil during the summer months, you need more than cover crops. You have to alter the chemistry of the soil to alter the soil structure so it can carry gas and water exchange through the dry-down.
9. Recommendations for Year Three
The principle in year 3 is to consolidate the gains, push the Ca:Mg ratio toward the structural target, and add potassium without disturbing the calcium-led recovery.
9.1 Calcium without magnesium
Any further liming should be calcitic, not dolomitic. Dolomite adds magnesium, which the plot does not need. Calcitic lime, gypsum (calcium sulfate, which adds Ca without raising pH further), or oyster shell flour are appropriate. As a working number, a calcium addition that moves the meq ratio from 4.14 toward 5.5 over one season is appropriate — sharper corrections risk a magnesium-deficient swing in tissue.
9.2 Potassium as sulfate, not chloride
Potassium sulfate (sulfate of potash) adds K and S together without chloride, which can be osmotically stressful on the new microbial community. Rate: enough to close the 48 ppm deficit, applied in two splits across the season rather than a single front-loaded dose.
9.3 Carbon, but the right kind
Compost is appropriate. Fresh manure is not — it would spike nitrogen and disturb the still-stabilizing aerobic bacterial community. Cover crop biomass terminated as a mulch rather than incorporated will continue to build organic matter without oxidizing the carbon gains of year 2.
9.4 Watch the irrigation water
The sodium doubling is small but real. A water test that includes Na, bicarbonate, and EC will tell us whether the source water is a slow accumulator. If it is, this becomes the limiting factor on long-term recovery.
9.5 Tissue test, not just soil test
By year 3, the soil report will show what is present. The plant tissue will show what is being taken up. A plant sap or whole-tissue test in mid-season — measuring Ca, Mg, K, B, Mo specifically — will tell us whether the residual Mg is still antagonizing K and B at the root, even though the soil report looks acceptable.
10. We Are the Soil
I cannot find the place where the soil ends and the plant begins. I cannot find the place where the plant ends and the animal — or the human — begins.
In the soil, chemistry and biology combine to make individual elements and complex compounds. These flow into and onto the plant. The plant takes them to another level of complexity. We consume the plant, or the animal that consumed the plant, and we are composed of the same elements and the same complex compounds. We host the same microbiology on us and in us. Our genetic code is laced with sequence that originated in the microbial communities our species evolved alongside.
We are not a reflection of the soil. We are the soil. We are not a reflection of the plant. We are the plant. Which means that when we study the soil and the plant carefully, we are studying systems that run through the entire continuum — and the patterns we identify in the field show up again, with the same chemistry and the same logic, in the body. The calcium-to-magnesium relationship that runs through this entire brief is the prime example.
10.1 The same ions, the same rules, every scale
Calcium tightens the clay. Calcium tightens the muscle. Magnesium releases the clay. Magnesium releases the muscle. The chemistry that makes a soil aggregate hold its shape is the same chemistry that lets a cardiac muscle cell contract — and the chemistry that lets the soil aggregate breathe through wet-dry cycles is the same chemistry that lets the heart relax between beats.
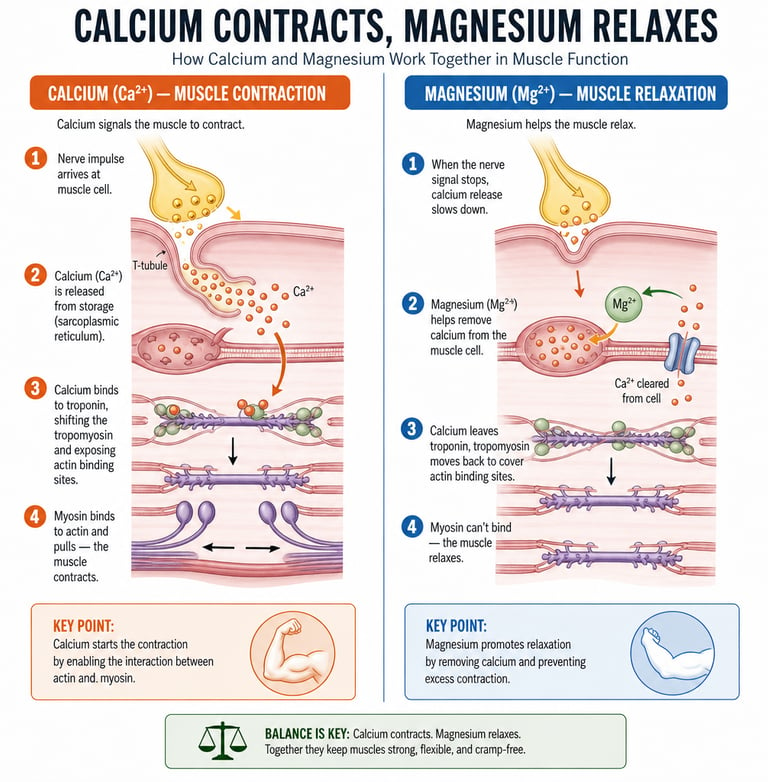
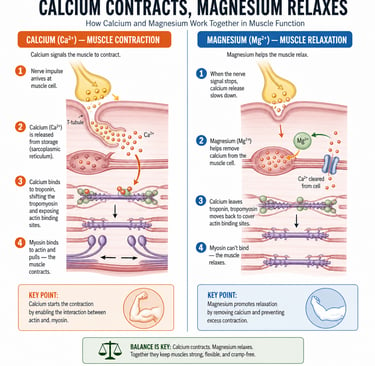
Figure 7. Calcium initiates contraction; magnesium releases it. The mechanism is the same one playing out in soil aggregates — Ca pulls platelets together, Mg holds them apart — only the structures are different. Same ions. Same rules. Every scale.
In a cardiac muscle cell, calcium triggers contraction. It floods in through membrane channels, binds the contractile proteins, and locks the actin and myosin filaments together. Magnesium, by contrast, releases the contraction. It binds ATP into the functional Mg-ATP complex that breaks the cross-bridges, runs the pumps that remove calcium from the cell, and gates off further contraction. Drop magnesium and the heart cannot relax. Drop calcium and the heart cannot contract. The same two ions, doing the same two complementary jobs.
This is not analogy. It is the same chemistry expressed at a different scale. Magnesium holds its hydration shell — it binds negatively charged surfaces and keeps them stable and separated. Calcium sheds its hydration shell — it bridges across negatively charged surfaces and locks them together. This is true on a clay platelet, on a troponin protein, on the bone matrix, on the chlorophyll molecule. The whole of biology runs on this complementary pair.
10.2 The body reads the same signals
The clinical signatures of this chemistry are familiar to anyone who has ever had a calf cramp at two in the morning. An eye twitch that comes and goes is almost always a magnesium deficiency — the muscle cannot release the contraction it just made. A calf cramp that wakes a person out of sleep is the same signal at a larger scale, the same chemistry asking for the same correction. A heart attack arriving in the emergency room is treated, among other interventions, with intravenous magnesium — to stop the contraction that will not release. The hospital and the test garden are using the same chemistry to solve the same problem.
This is not analogy. It is identity. The clay platelet and the cardiomyocyte both carry negative surface charges. They both need divalent cations to bridge those charges into functional structure, and they both need a second divalent cation to release the bridge when the moment of contraction is over. Calcium and magnesium evolved into these complementary roles billions of years before there was any biological distinction between soil and tissue.
10.3 Why this matters for the work
The practical consequence is that the farmer who corrects a magnesium-locked soil is not just growing better crops. They are restoring the chemistry that flows into the food that feeds the body that runs on the same chemistry. The lab numbers in this brief — Ca:Mg ratio, base saturation percentages, microbial activity — describe conditions that translate up through the system into plant tissue mineral density, into food nutritional quality, and into the body's ability to do its own version of contract-and-release at every scale from muscle fibers to heart valves to nerve signals.
When we balance the calcium-to-magnesium ratio in a soil, we are not just chasing an agronomic target. We are restoring the structural-chemical pattern that runs from the clay platelet up through the root, up through the leaf, up through the food, into the body of the person who eats it. The same ratio that makes a soil breathe makes a heart beat.
The closing
The soil is the body, projected outward. The body is the soil, projected inward. Calcium pulls. Magnesium spreads. Everything else is consequence.
About ORCA
This brief is published by the Organic Regenerative Certified Apprenticeship (ORCA), a California nonprofit founded in 2025 (California Division of Apprenticeship Standards #101310; United States Department of Labor registered). ORCA develops the next generation of soil and food-system practitioners through a multi-sector apprenticeship curriculum rooted in precision mineral management, biological farming, and the soil-plant-human-health continuum that runs through this entire document.
ORCA delivers this curriculum across several settings: farm-to-school programs, market gardeners and home gardeners, tribal communities developing food sovereignty, and the ORCA One Health Garden Program in correctional facilities and hospitals (framed within the NASEM 2024 One Health framework). The principles in this brief are the educational core of every ORCA program regardless of the community it serves.
This document is part of ORCA's open educational library and is intended for free distribution to farmers, gardeners, apprentices, and community-program partners. It is teaching material — built to be read, photocopied, marked up, argued with, and put to work on the ground.
The specific implementation work — calibrating amendment rates for a given site, product selection, sequencing, retention monitoring, and ongoing diagnostics — is the consulting practice of Surprise Valley Agroecology, LLC, the affiliated practitioner consultancy that operates alongside ORCA's educational mission. SVA contributes over thirty years of field experience to ORCA's curriculum; ORCA carries that knowledge into the communities that need it most.
Sources and lineage
Soil data: Logan Labs, LLC, Mehlich III extraction, two-sample comparison for site R2 (April 2022 and April 2023).
Theoretical framework: cation balance targets from W. A. Albrecht (University of Missouri); ion-hydration chemistry from standard physical chemistry references; cardiac cation chemistry from standard physiology; soil food web and microbial loop framework from established soil microbiology. The trophobiosis framework follows Francis Chaboussou, with contemporary extensions from Larry Phelan (nutritional mediation hypothesis), Olivier Husson (soil and plant redox potential), and John Kempf (plant sap analysis as in-season diagnostic).
Field interpretation: Surprise Valley Agroecology, in-house apprenticeship curriculum, ORCA One Health Garden Program.